You can leverage anomaly detection to analyze vast amount of logs in many different ways. Some analytics approaches require real-time detection, such as application monitoring, event detection, and fraud detection. Others involve analyzing past data to identify the trends and patterns, isolate the root cause and prevent them from happening again in the future. The anomaly detection plugin in OpenSearch already supports real-time streaming data. In OpenSearch 1.1.0, the team introduced support for anomaly detection on historical data. Often-times, the historical and real-time use cases work hand-in-hand. You may find real-time anomalies in your data, and decide to run historical detection to search for similar patterns in the past. Or, you may first search for anomalies in the past data, then decide to configure anomaly detection to monitor your system for anomalies in real-time. OpenSearch 1.1.0 also streamlines the anomaly detection configuration with the new unified flow that allows you to configure an anomaly detector once that can then be applied to both real-time or historical analysis. In this blog, I will review each of the steps in the unified workflow with an example.
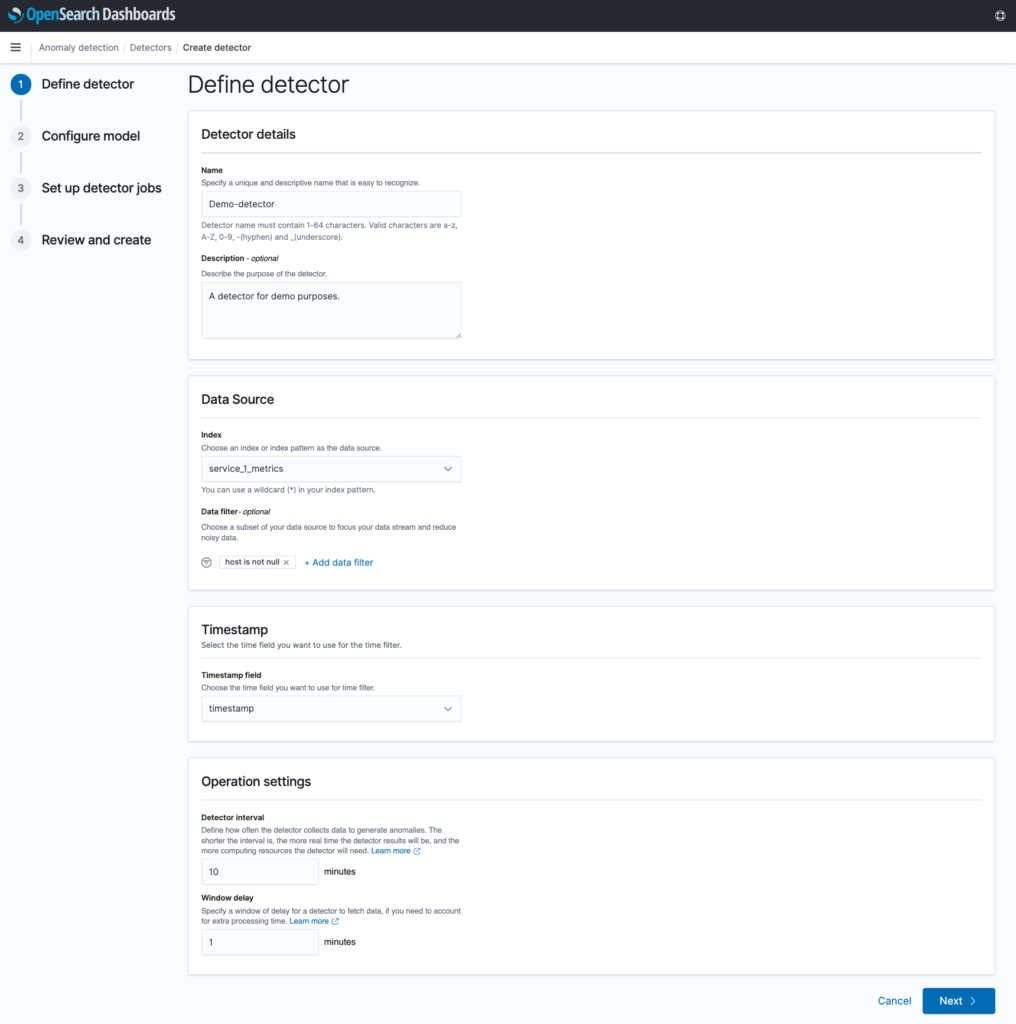
Consider an index service_1_metrics which contains different performance metrics for a service named service_1. The index service_1_metrics contains the fields host, cpu_utilization, mem_utilization, and timestamp, where host is the specific host that’s reporting the metrics, cpu_utilization is the current CPU utilization percentage reported by that host, mem_utilization is the current memory utilization percentage reported by that host, and timestamp is the time when the metrics were collected. Now, suppose you are interested in setting up anomaly detection on the CPU utilization and memory utilization metrics.
In Step 1, you define the basic detector configuration – a detector is an individual anomaly task. You can have multiple detectors running in your cluster at any time. The detector settings include the detector name and description, details about the data source, and detector interval. Here, you would select the service_1_metrics index, and perhaps add some preprocessing to the data by adding a data filter to ignore any documents in the index where host is null. You would also select timestamp as the configured timestamp field. Under “Operation settings”, you can tune how often you want to collect results with the “Detector interval” setting. Suppose the service_1_metrics collects results from all hosts every minute, and indexes a new document for each host every minute. In this case, using the default interval of 10 minutes is reasonable. This means the detector will aggregate the real-time source data and produce anomaly results every 10 minutes.
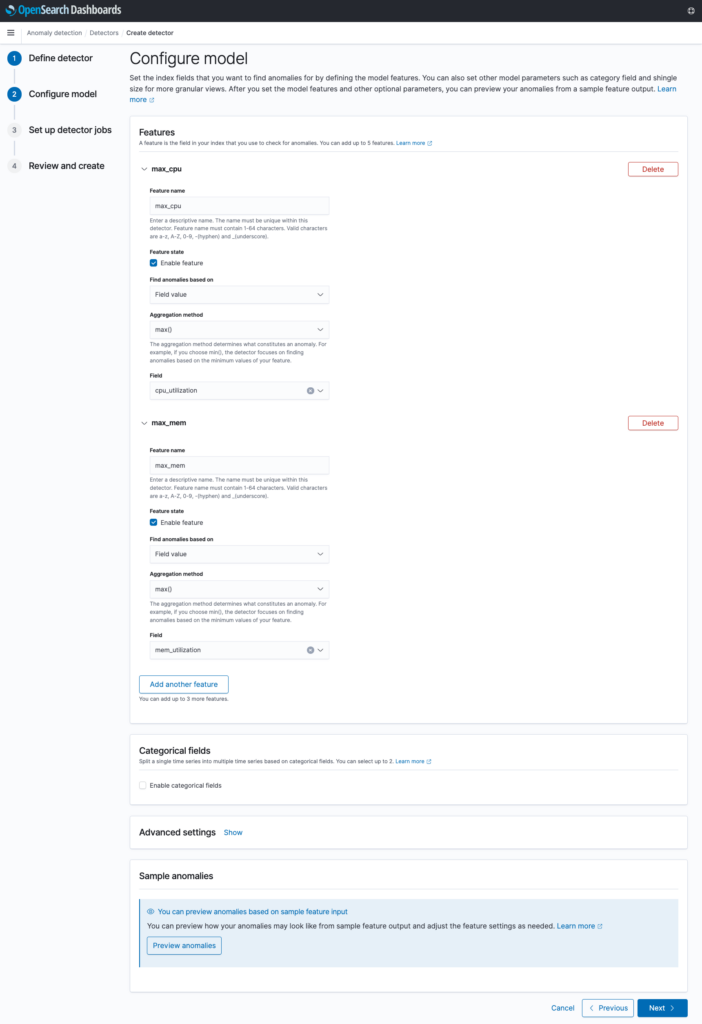
In Step 2, you configure your features and other model settings. Up to five features can be configured per detector. In this example, you would want to create two features – one for analyzing the CPU utilization metrics, and one for analyzing the memory utilization metrics. Under “Categorical fields”, you can optionally select a field to partition the source data on. For example, by selecting the host field, a separate set of anomaly results will be produced for each unique host that is found in the index, allowing for a more fine-grained analysis of the data. By not selecting any categorical fields, all of the data will be treated as a single time series, and a single set of anomaly results will be produced.
After making selections, you can optionally preview how the detector may perform by clicking “Preview anomalies”, which will sample existing source data and produce sample anomaly results.
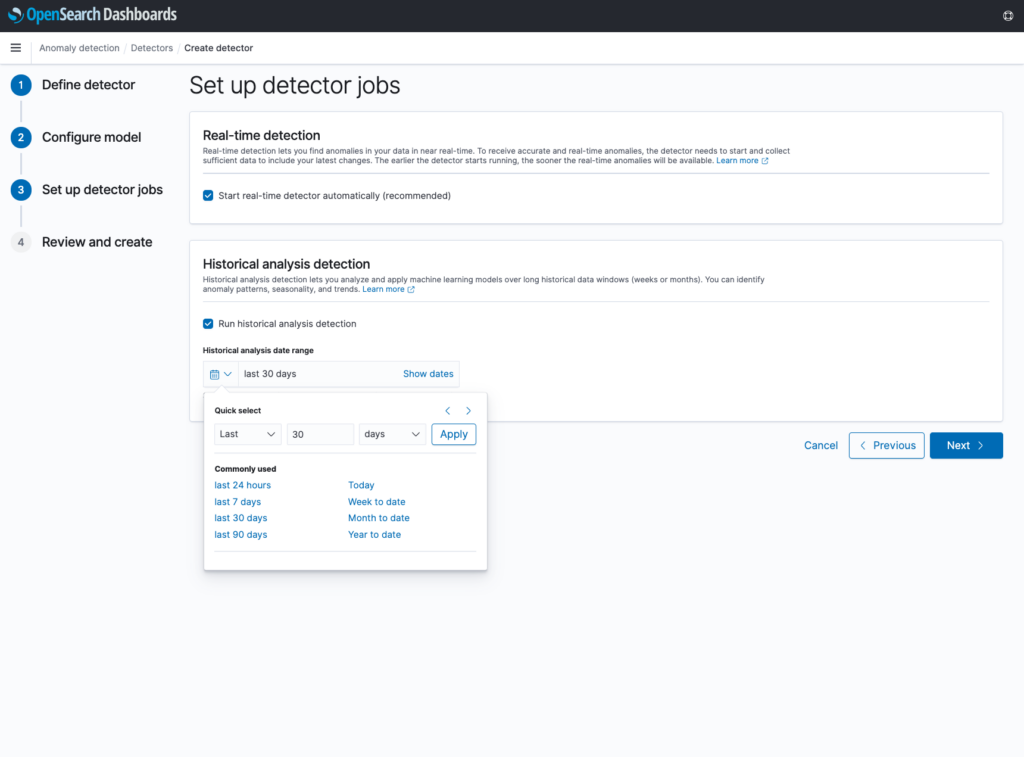
In Step 3, you select the anomaly detection jobs you want to run upon creation – real-time or historical. If historical analysis is selected, you can configure the date range to run the detection on. Suppose the service_1_metrics index has 30 days of data on it already – you may decide to run a historical analysis on the last 30 days to see if any historical anomalies were detected in the data.
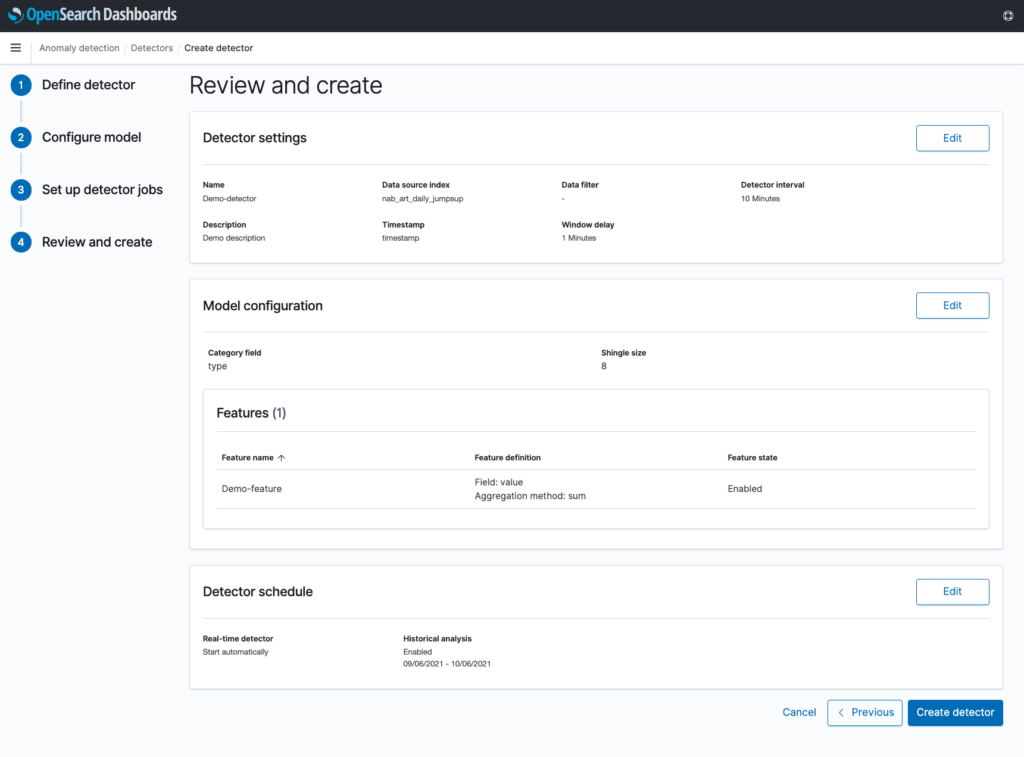
In Step 4, you can review and edit any of the selections made in the previous steps. When clicking “Create detector”, the detector will be created, and any selected real-time or historical analysis will begin running. Note that these can always be started or restarted at a later time as well.
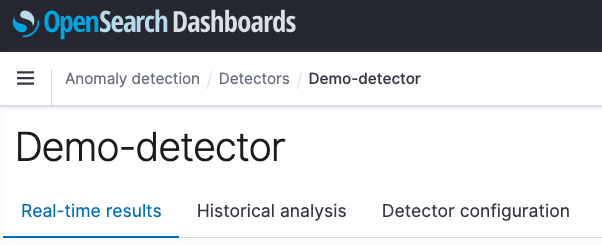
After creation, real-time results can be viewed under the “Real-time results” tab, and historical results can be viewed under the “Historical analysis” tab. The “Detector configuration” tab contains the configuration used and shared by any existing real-time and historical anomaly detection jobs.
The user interface for viewing historical results is similar to the real-time results, but with a few extra helpful features:
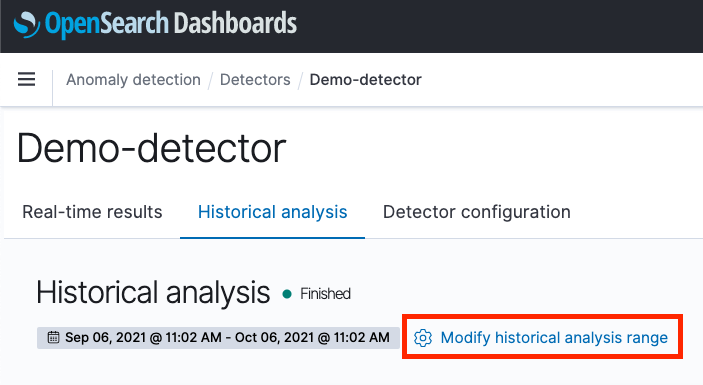
- You always have the option to run a new historical analysis and select a new date range, by clicking on the “Modify historical analysis range” button, highlighted in red below. Note that only the latest historical analysis job will be persisted and visible on this page. Previous runs and anomaly results will be discarded.
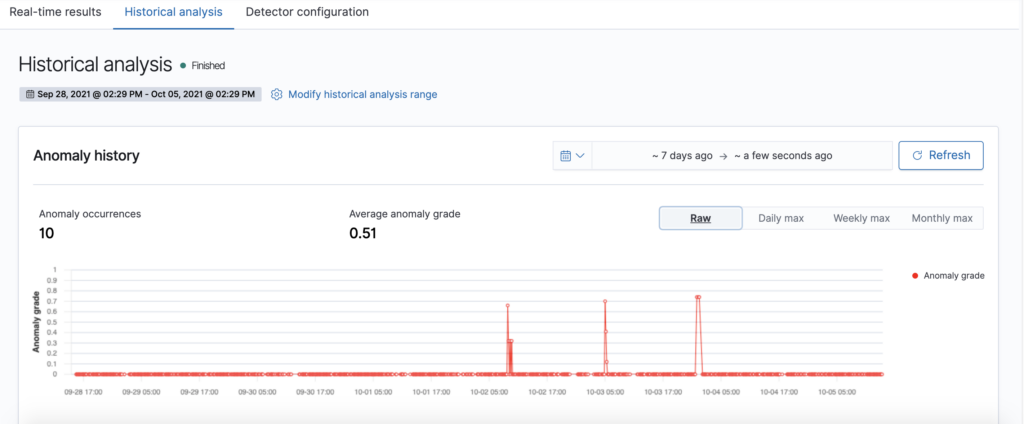
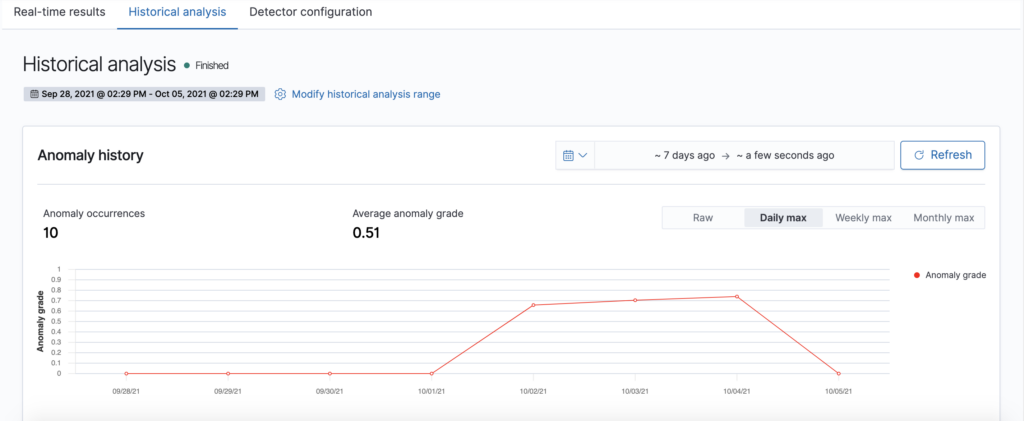
- As the historical analysis is running, the page will automatically refresh to show partial results, along with a progress bar. When the detection job is finished, you can zoom and view the anomaly results, as well as aggregate them on-the-fly by clicking on the “Daily max” / “Weekly max” / “Monthly max” buttons. Currently, only max anomaly grade aggregations are supported.
There are a few other changes to the Anomaly Detection Dashboards Plugin in 1.1.0 worth mentioning:
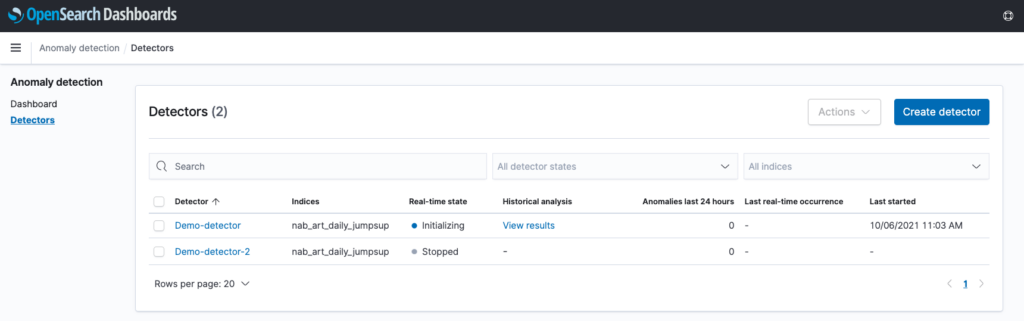
- On the detector list page, an additional column related to historical analysis has been added. If there is any existing historical analysis found for a detector, a “View results” link will appear, which will navigate to the “Historical analysis” tab on the detector’s detail page.
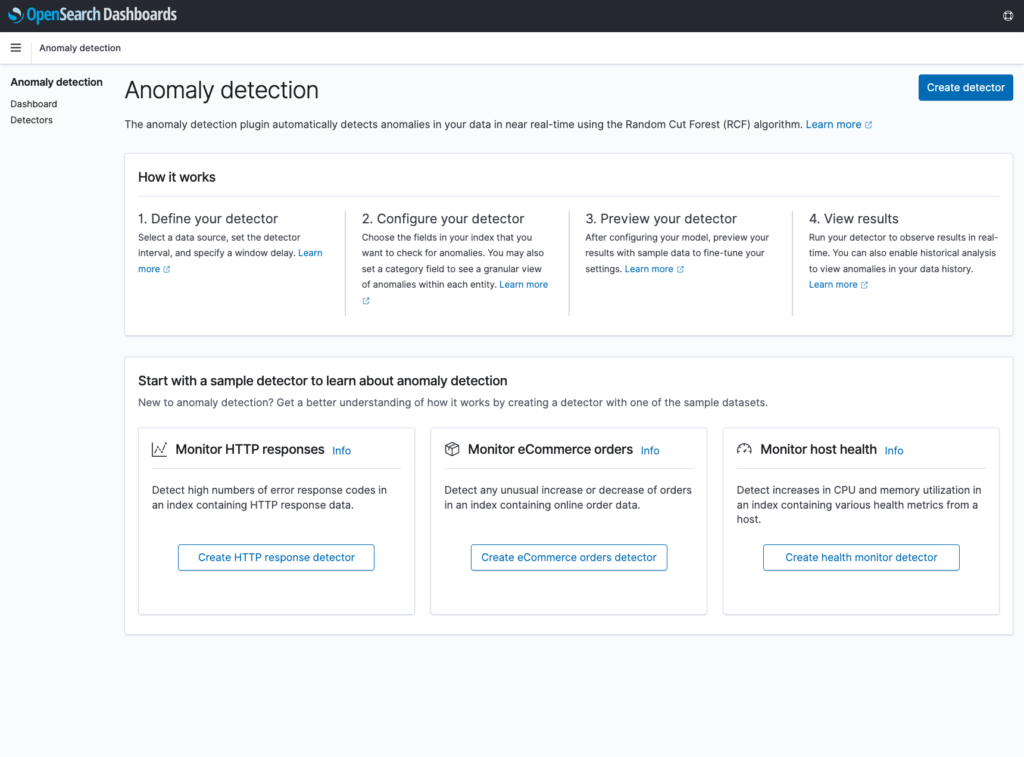
- The sample detectors page has been moved into a new “Overview” page, which provides additional high-level information about anomaly detection. This page can always be accessed by clicking on the “Anomaly detection” title in the side navigation bar.
Conclusion
In this blog post, I discussed two new features released in OpenSearch 1.1.0 – anomaly detection for historical data and universal flow in OpenSearch Dashboards that enables you to just configure once and detect anomalies on real-time and historical data. Anomaly detection for historical data helps you analyze and identify trends and patterns in past data. You can use these insights to make better decisions, improve planning, and boost the overall operational efficiency of your applications.
The team welcomes you to come join in and contribute with us in building many more exciting features in anomaly detection and machine learning. You can learn more by visiting the Anomaly Detection OpenSearch Plugin and Anomaly Detection OpenSearch Dashboards Plugin GitHub repositories.