You're viewing version 2.4 of the OpenSearch documentation. This version is no longer maintained. For the latest version, see the current documentation. For information about OpenSearch version maintenance, see Release Schedule and Maintenance Policy.
Using VisBuilder
VisBuilder is an experimental feature and shouldn’t be used in a production environment. For updates on its progress, or if you want to leave feedback that helps improve the feature, see the GitHub issue.
You can use the VisBuilder visualization type in OpenSearch Dashboards to create data visualizations by using a drag-and-drop gesture. With VisBuilder you have:
- An immediate view of your data without the need to preselect the visualization output.
- The flexibility to change visualization types and index patterns quickly.
- The ability to easily navigate between multiple screens.
Try VisBuilder in the OpenSearch Dashboards playground
If you’d like to try out VisBuilder without installing OpenSearch locally, you can do so in the Dashboards playground. VisBuilder is enabled by default.
Try VisBuilder locally
VisBuilder is enabled by default. If you want to disable it, set the feature flag vis_builder.enabled: to false in the opensearch_dashboards.yml file as follows:
# Set the value of this setting to false to disable VisBuilder
# functionality in Visualization.
vis_builder.enabled: false
Follow these steps to create a new visualization using VisBuilder in your environment:
- Open Dashboards:
- If you’re not running the Security plugin, go to http://localhost:5601.
- If you’re running the Security plugin, go to https://localhost:5601 and log in with your username and password (default is admin/admin).
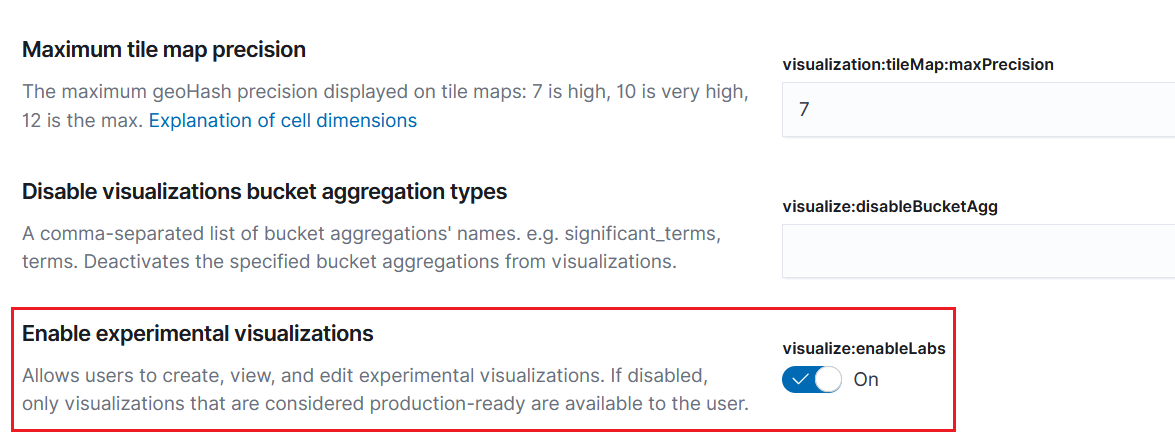
- Confirm that the Enable experimental visualizations option is turned on.
- From the top menu, select Management > Stack Management > Advanced Settings.
- Select Visualization and verify that the option is turned on.
-
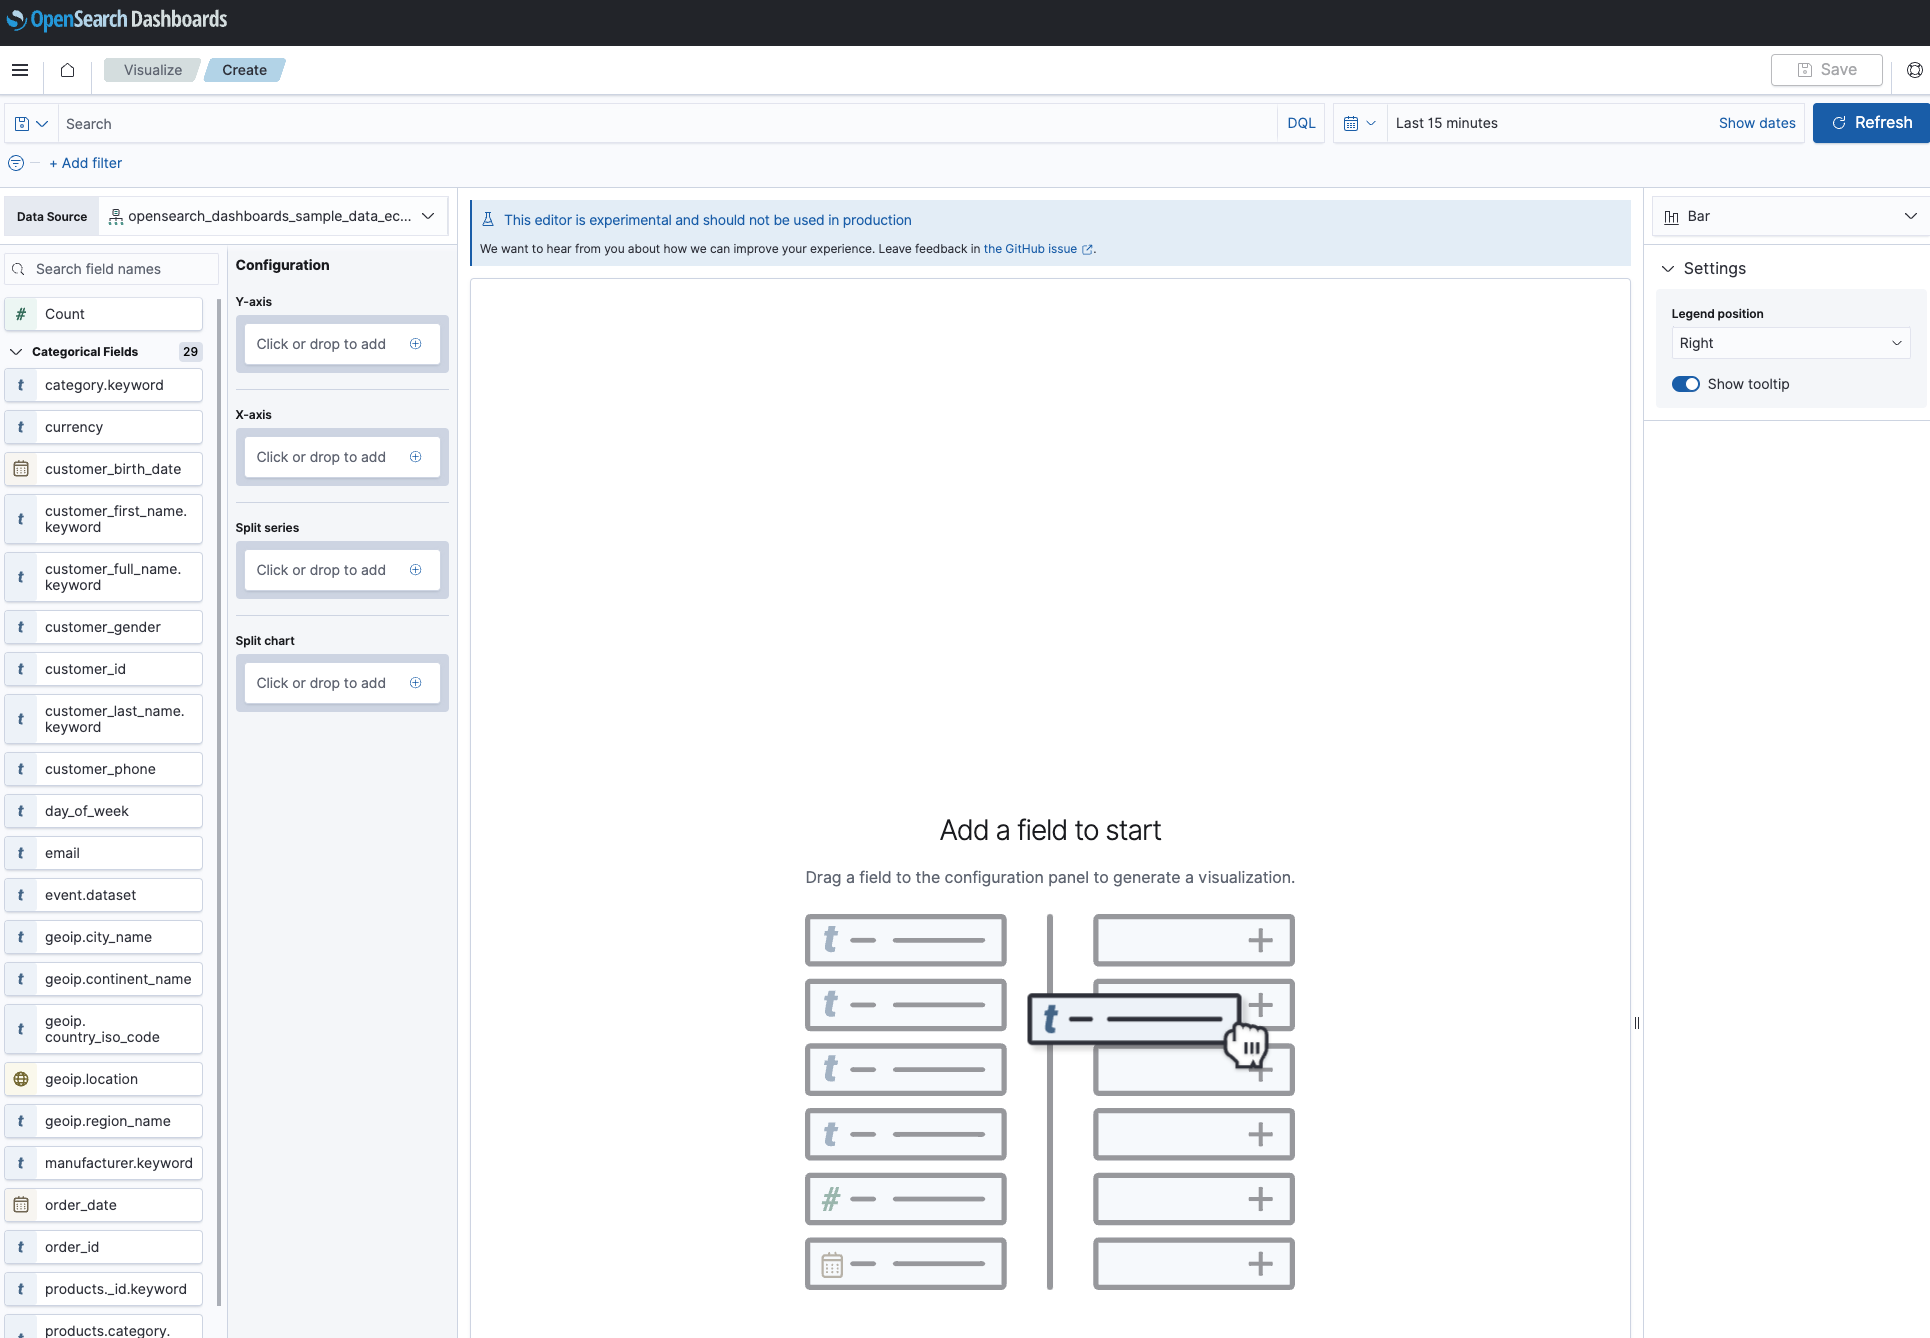
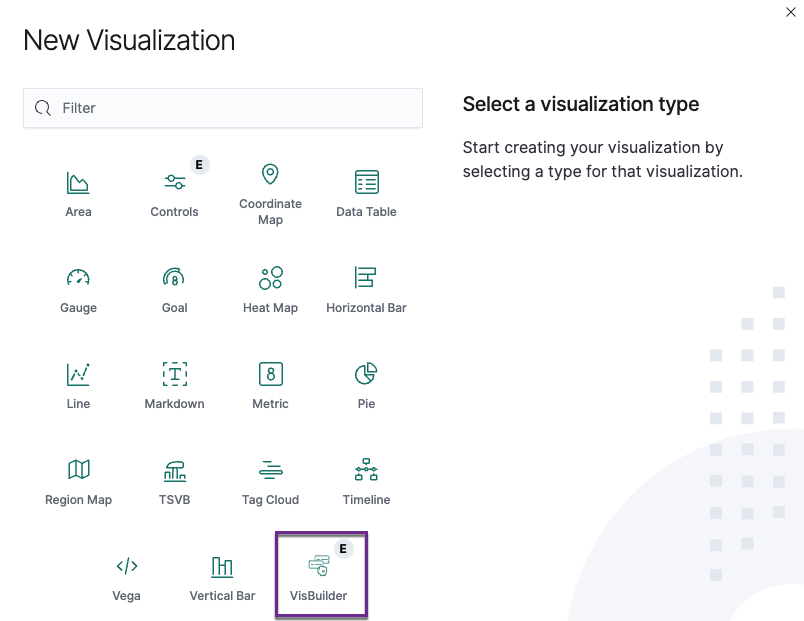
From the top menu, select Visualize > Create visualization > VisBuilder.
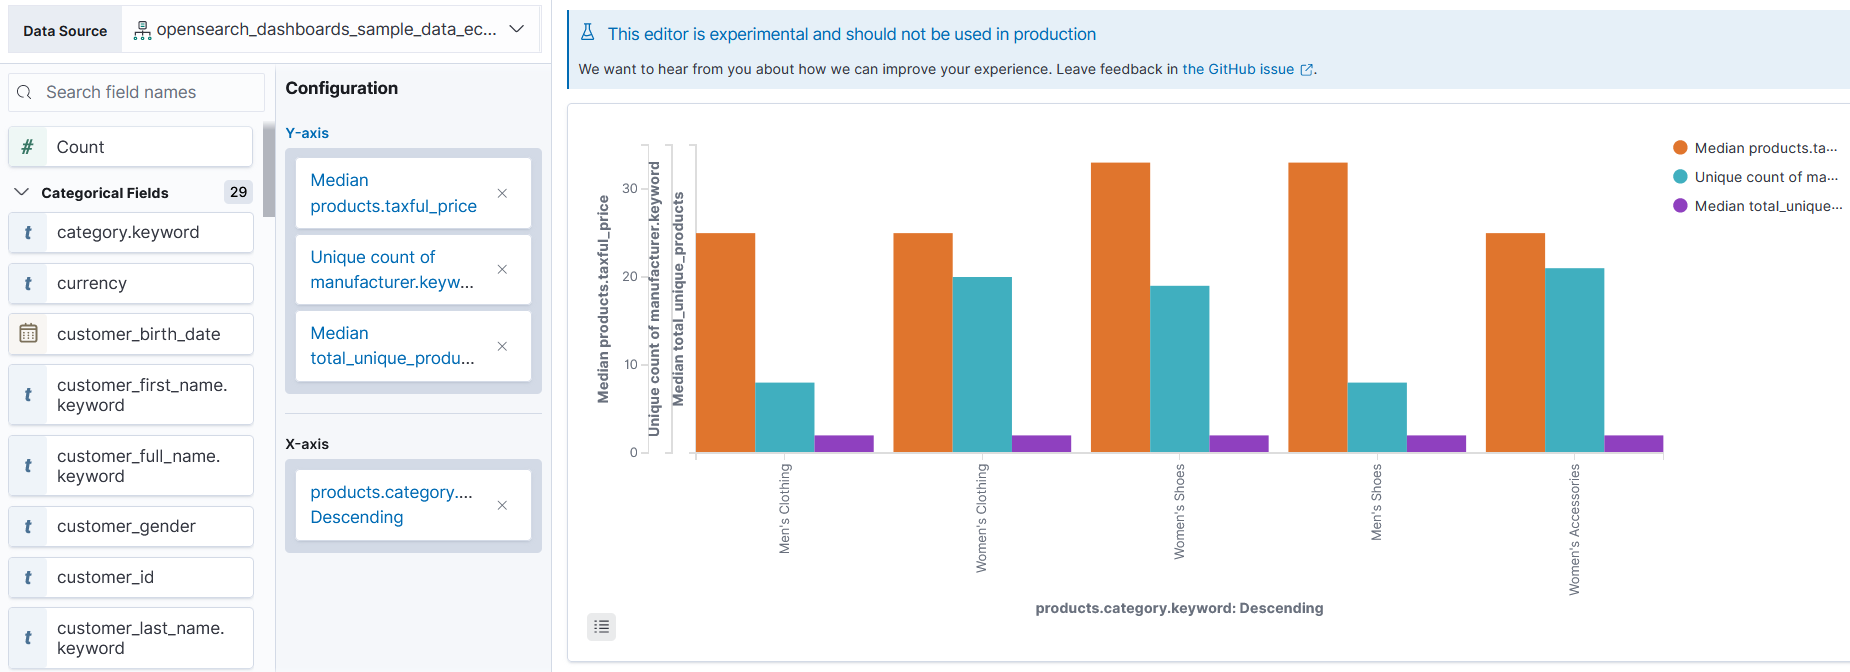
- Drag and drop field names from the left column into the Configuration panel to generate a visualization.
Here’s an example visualization. Your visualization will look different depending on your data and the fields you select.