You're viewing version 2.4 of the OpenSearch documentation. This version is no longer maintained. For the latest version, see the current documentation. For information about OpenSearch version maintenance, see Release Schedule and Maintenance Policy.
Notebooks
An OpenSearch Dashboards notebook is an interface that lets you easily combine code snippets, live visualizations, and narrative text in a single notebook interface.
Notebooks let you interactively explore data by running different visualizations that you can share with team members to collaborate on a project.
A notebook is a document composed of two elements: code blocks (Markdown/SQL/PPL) and visualizations. Choose multiple timelines to compare and contrast visualizations.
You can also generate reports directly from your notebooks.
Common use cases include creating postmortem reports, designing runbooks, building live infrastructure reports, and writing documentation.
Tenants in OpenSearch Dashboards are spaces for saving notebooks and other OpenSearch Dashboards objects. For more information, see OpenSearch Dashboards multi-tenancy.
Get started with notebooks
To get started, choose Notebooks within OpenSearch Dashboards.
Step 1: Create a notebook
A notebook is an interface for creating reports.
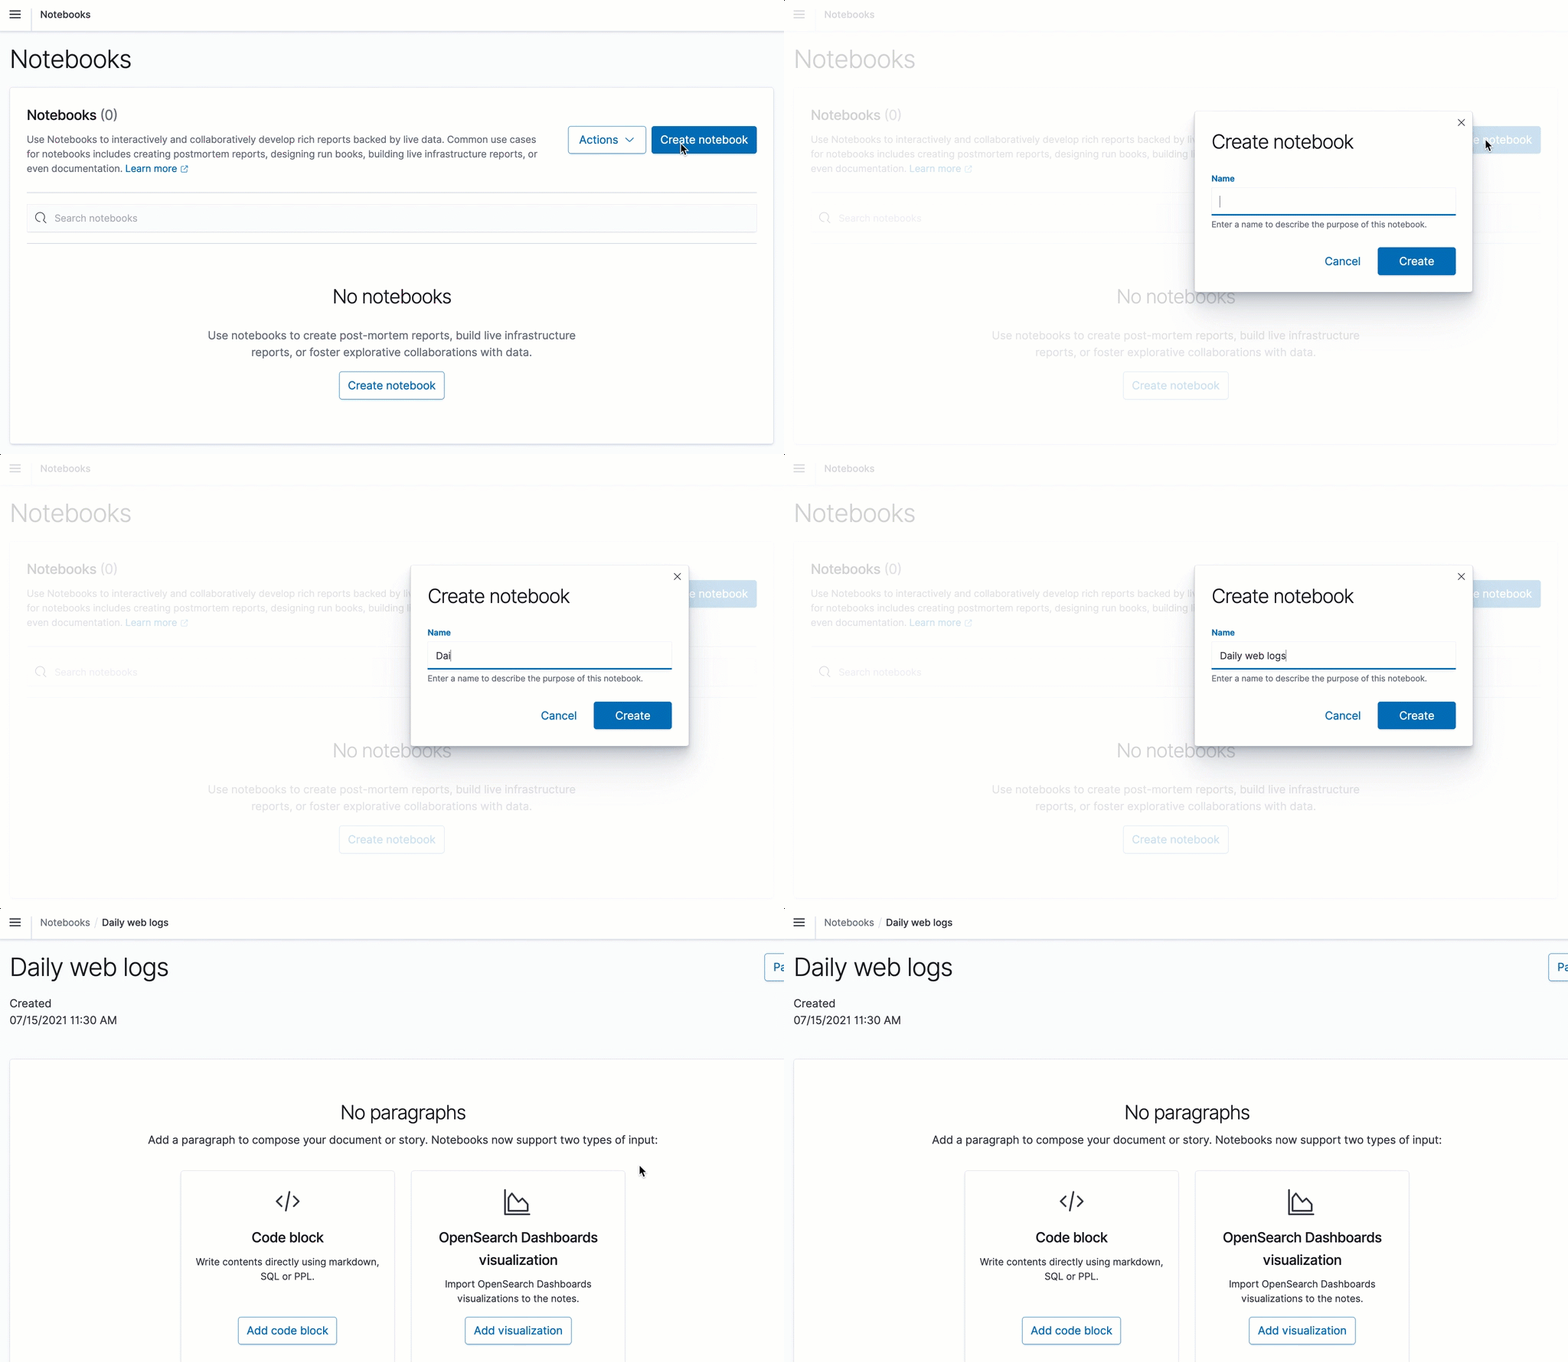
- Choose Create notebook and enter a descriptive name.
- Choose Create.
Choose Actions to rename, duplicate, or delete a notebook.
Step 2: Add a paragraph
Paragraphs combine code blocks and visualizations for describing data.
Add a code block
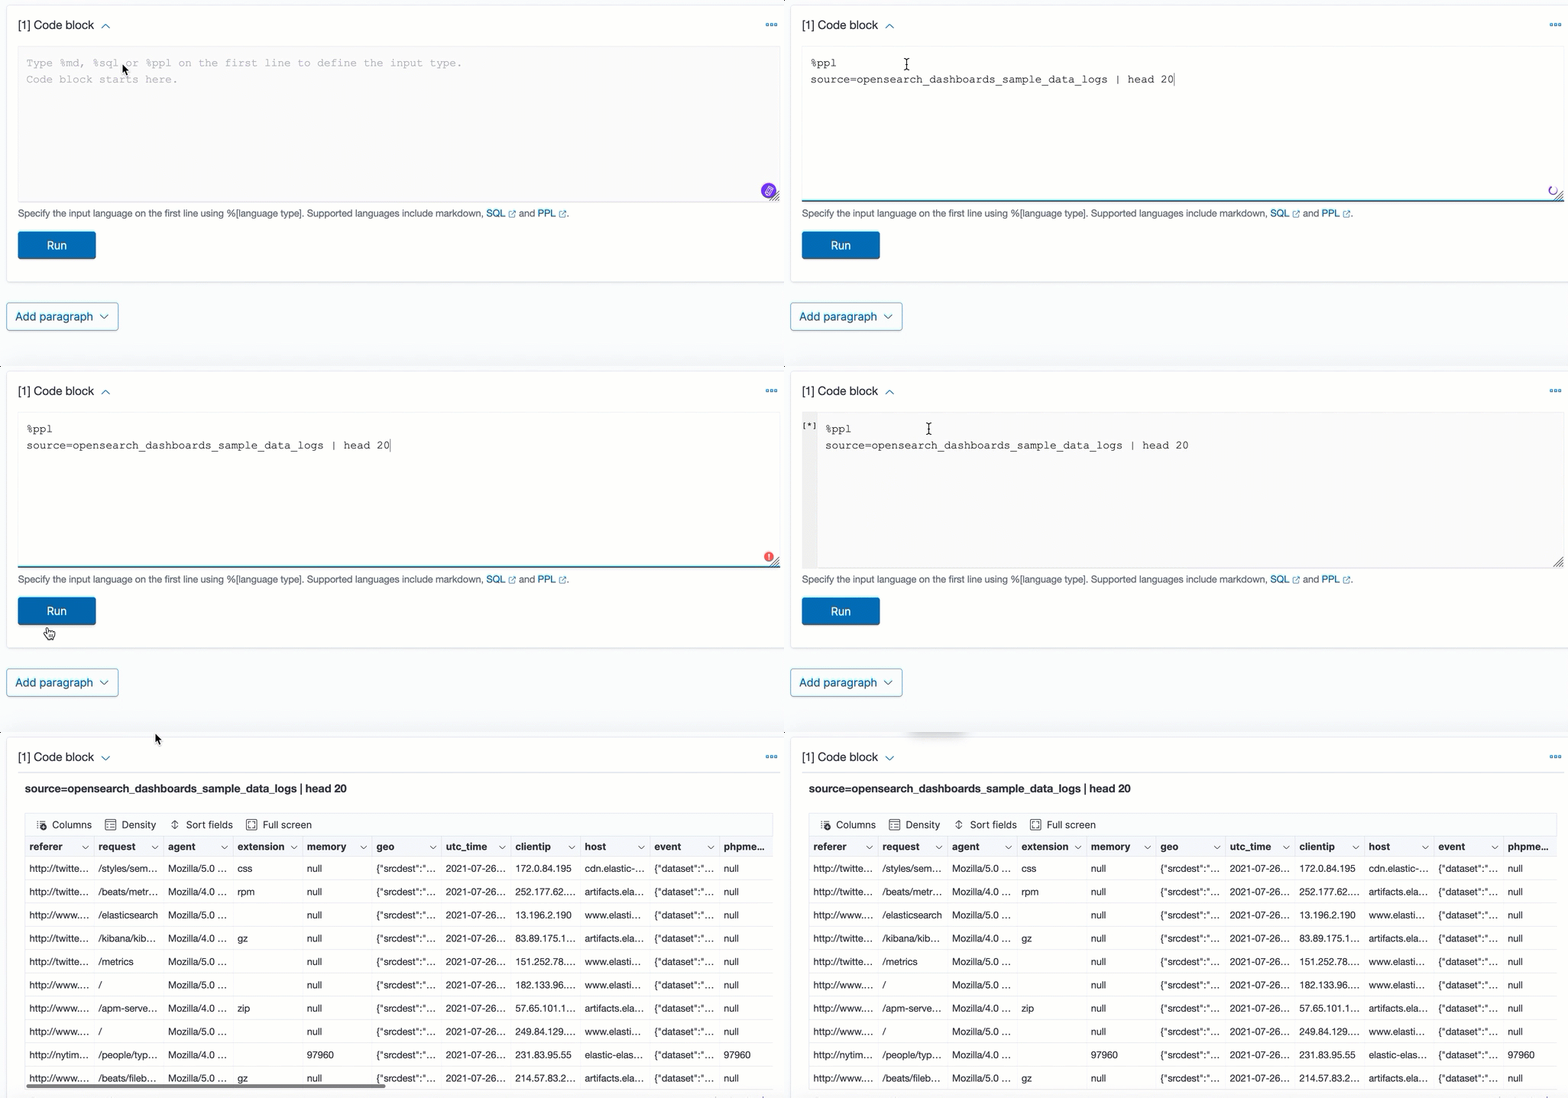
Code blocks support markdown, SQL, and PPL languages.
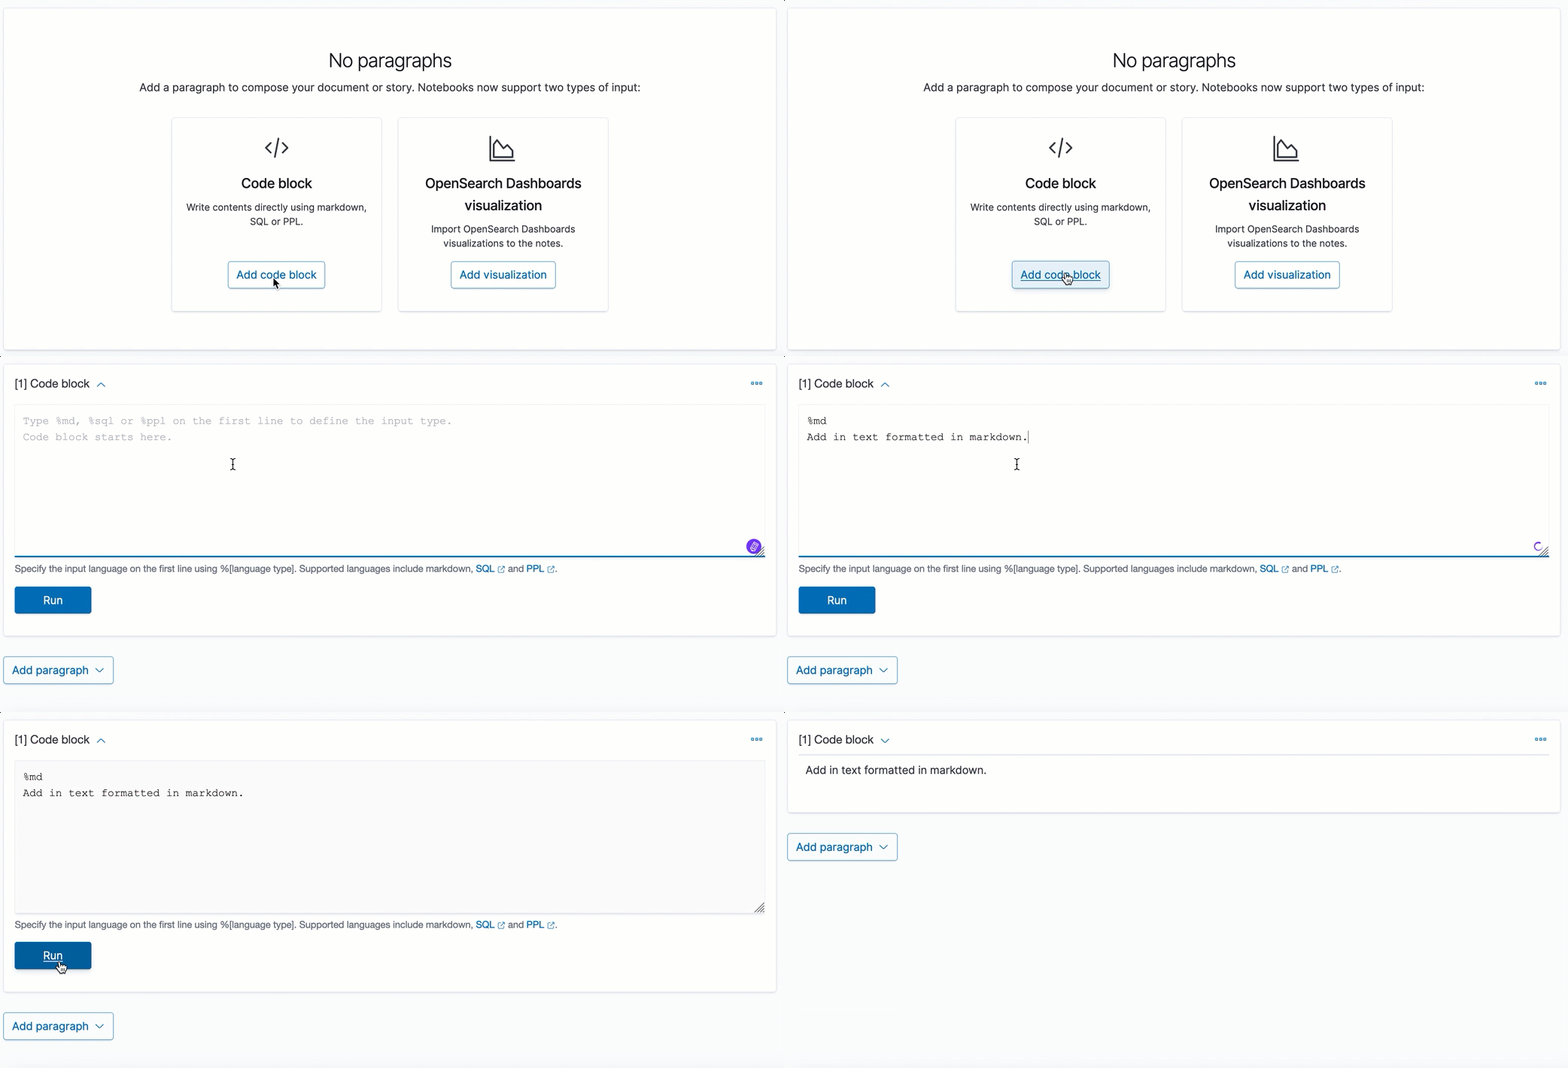
Specify the input language on the first line using %[language type] syntax. For example, type %md for markdown, %sql for SQL, and %ppl for PPL.
Sample markdown block
%md
Add in text formatted in markdown.
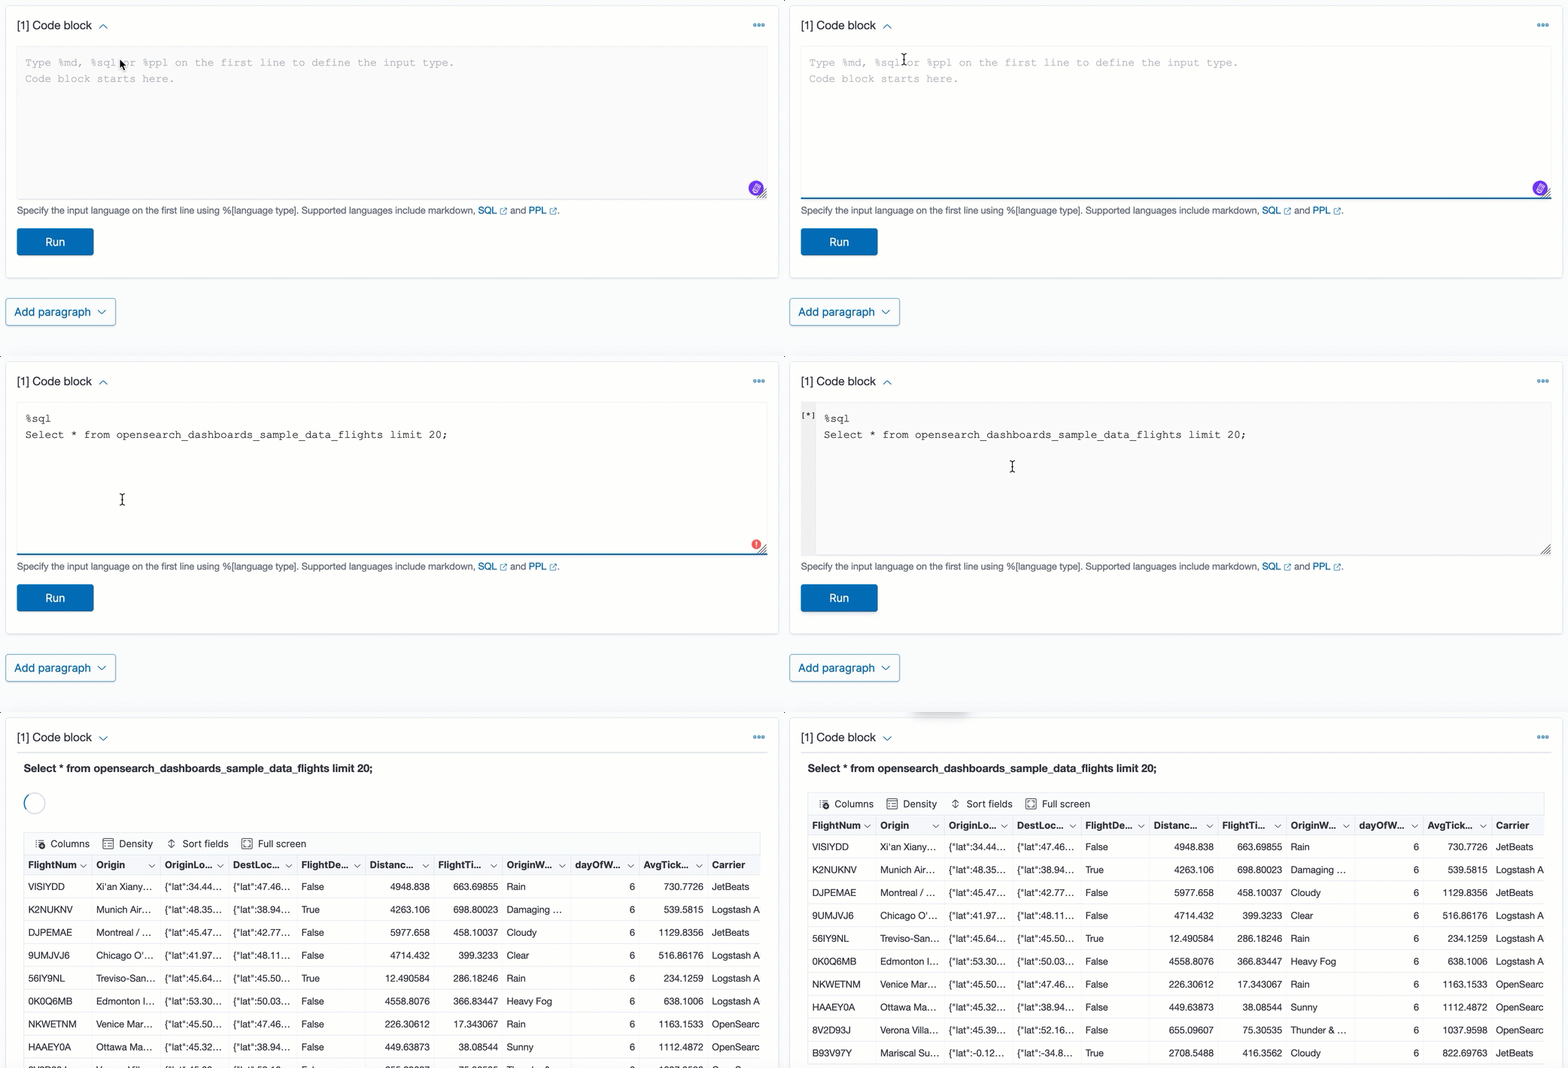
Sample SQL block
%sql
Select * from opensearch_dashboards_sample_data_flights limit 20;
Sample PPL block
%ppl
source=opensearch_dashboards_sample_data_logs | head 20
Add a visualization
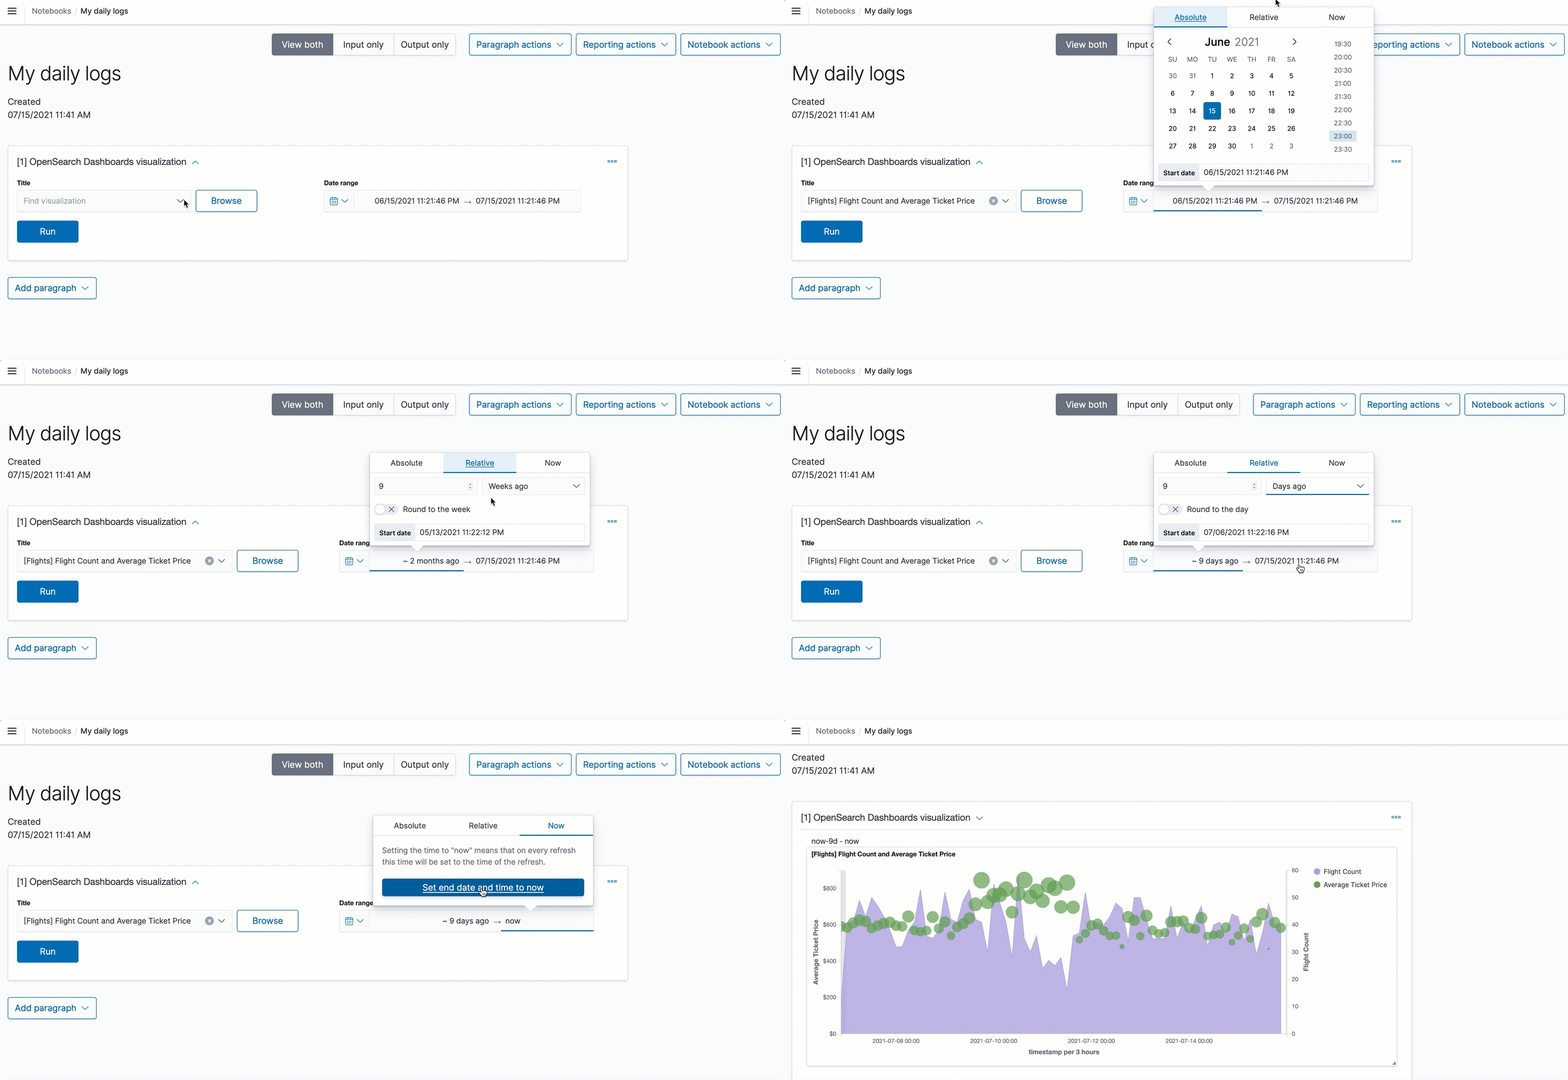
- To add a visualization, choose Add paragraph and select Visualization.
- In Title, select your visualization and choose a date range. You can choose multiple timelines to compare and contrast visualizations.
- To run and save a paragraph, choose Run.
Paragraph actions
You can perform the following actions on paragraphs:
- Add a new paragraph to the top of a report.
- Add a new paragraph to the bottom of a report.
- Run all the paragraphs at the same time.
- Clear the outputs of all paragraphs.
- Delete all the paragraphs.

Sample notebooks
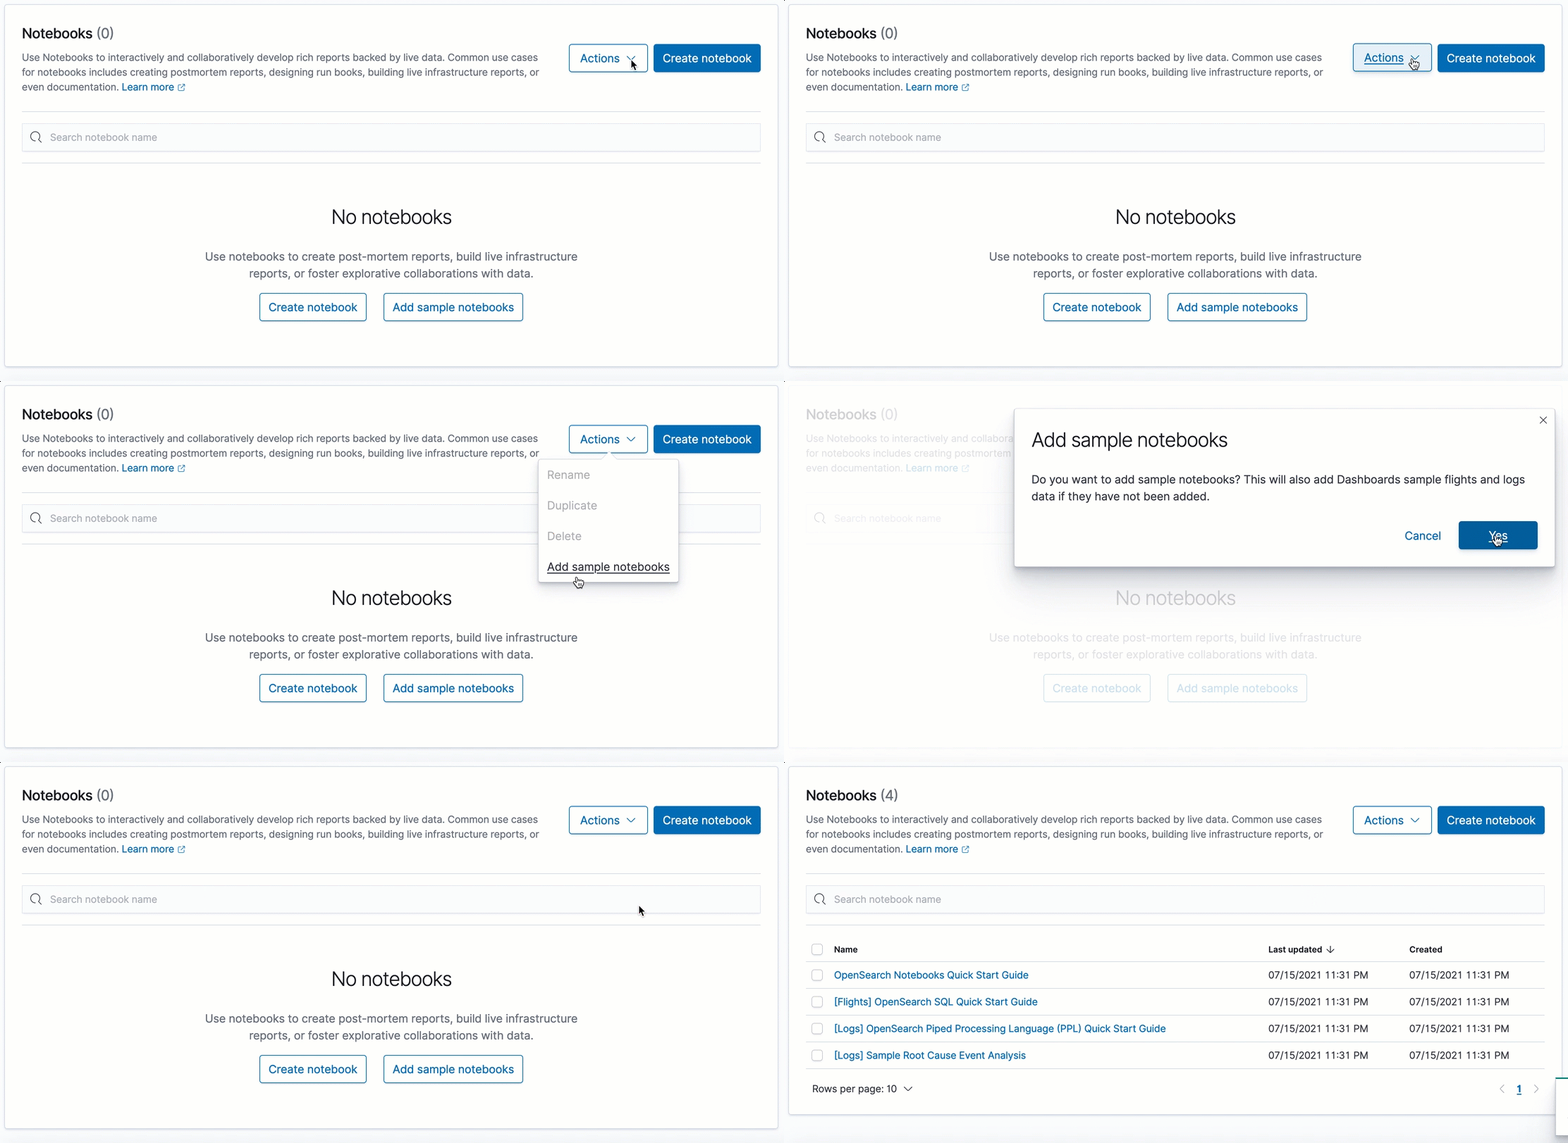
We prepared the following sample notebooks that showcase a variety of use cases:
- Using SQL to query the OpenSearch Dashboards sample flight data.
- Using PPL to query the OpenSearch Dashboards sample web logs data.
- Using PPL and visualizations to perform sample root cause event analysis on the OpenSearch Dashboards sample web logs data.
To add a sample notebook, choose Actions and select Add sample notebooks.
Create a report
You can use notebooks to create PNG and PDF reports:
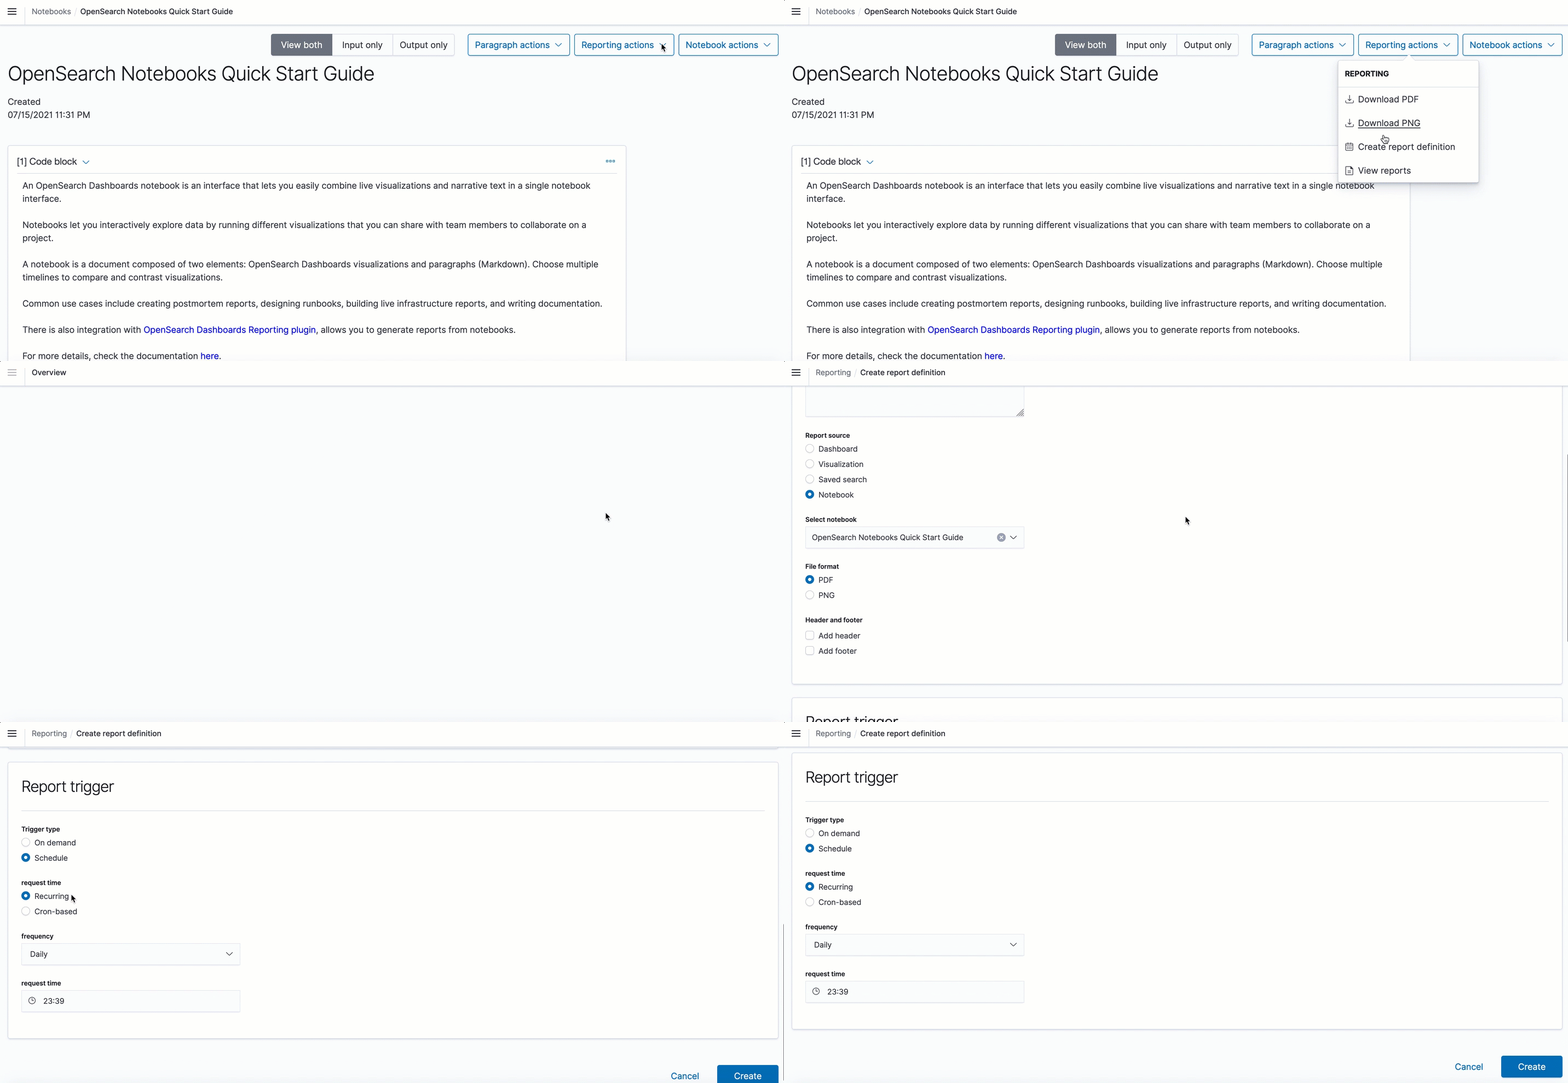
- From the top menu bar, choose Reporting actions.
-
You can choose to Download PDF or Download PNG.
Reports generate asynchronously in the background and might take a few minutes, depending on the size of the report. A notification appears when your report is ready to download.
- To create a schedule-based report, choose Create report definition. For steps to create a report definition, see Creating reports using a definition.
- To see all your reports, choose View all reports.
