You're viewing version 2.7 of the OpenSearch documentation. This version is no longer maintained. For the latest version, see the current documentation. For information about OpenSearch version maintenance, see Release Schedule and Maintenance Policy.
Adding multiple data sources
Use OpenSearch Dashboards to dynamically manage data sources, create index patterns based on those data sources, run queries against a specific data source, and combine visualizations in one dashboard.
Learn how to enable the data_source setting in Dashboards; add credentials, data source connections, and index patterns; and combine visualizations in a single dashboard in this tutorial.
Modifying the YAML file settings for multiple data sources
This tutorial uses a preconfigured data source and index pattern for which you aren’t required to configure settings. However, you have to enable the multiple data sources feature because it is disabled by default.
To enable multiple data sources:
- Navigate to your Dashboards home directory, for example, in Docker,
/usr/share/opensearch-dashboards. - Open your local copy of the Dashboards configuration file,
opensearch_dashboards.yml. If you don’t have a copy,opensearch_dashboards.ymlis available on GitHub. - Set
data_source.enabled:totrueand save the YAML file. - Restart the Dashboards container.
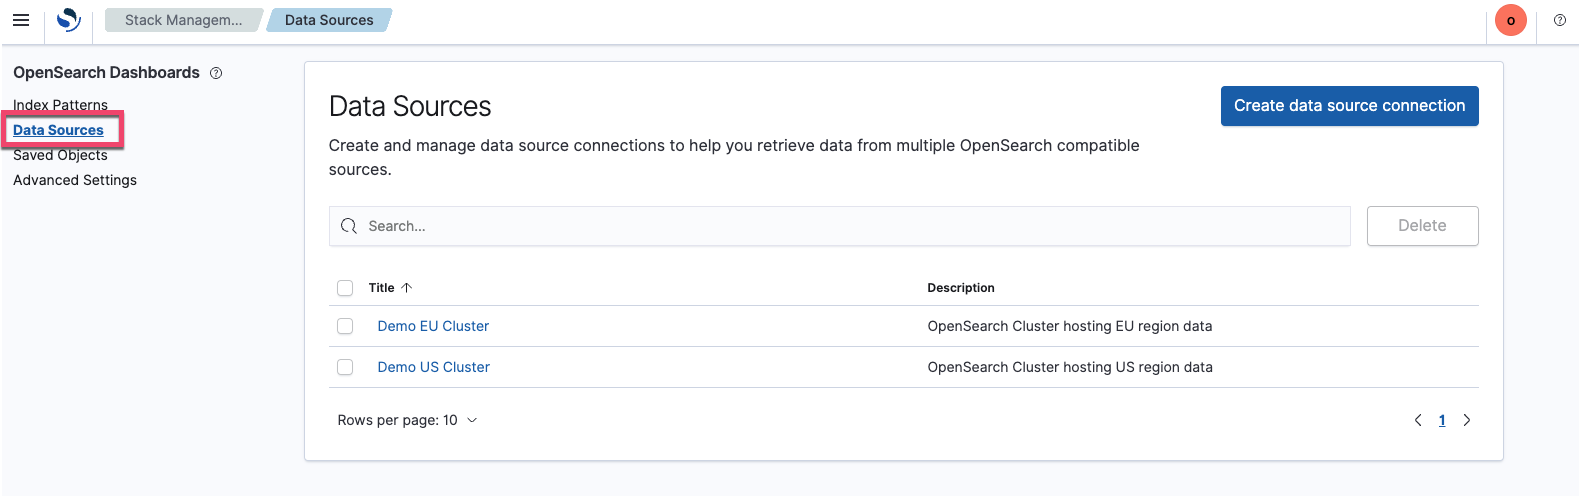
- Verify that the configuration settings were created and configured properly by connecting to Dashboards and viewing the Stack Management console. Data Sources appears in the sidebar, as shown in the following image.
Creating a data source connection
A data source connection specifies the parameters needed to connect to a data source. These parameters form a connection string for the data source. In Dashboards, you can add new data source connections or edit existing connections.
To create a new data source connection:
- Go to
http://localhost:5601and log in with the usernameadminand passwordadmin. If you’re running the Security plugin, go tohttps://localhost:5601. - From the OpenSearch Dashboards main menu, select Stack Management, Data Sources, and then Create data source connection.
-
Add information to each field to configure Connection Details, Endpoint URL, and Authentication Method.
In the Connection Details window, enter a title. Entering a description is optional.
In the Endpoint window, enter the Endpoint URL. For this tutorial, use the URL
http://localhost:5601/app/management/opensearch-dashboards/dataSources.In the Authentication window, select an Authentication Method. The options are:
- No authentication: No authentication is used to connect to the data source.
- Username & Password: A basic username and password are used to connect to the data source.
- AWS Sigv4: An AWS Signature Version 4 authenticating request is used to connect to the data source. AWS Sigv4 requires an access key and a secret key. First specify the Region, and then enter the Access Key and Secret Key for authorization. For information about available AWS Regions for AWS accounts, see Available Regions. For more about Sigv4 authentication requests, see Authenticating Requests (AWS Signature Version 4).
When you select the authentication method, the applicable fields appear for the selected method. Enter the required details.
After you have entered the appropriate details in all of the required fields, the Test connection and Create data source connection buttons become active. You can select Test connection to confirm that the connection is valid.
-
Select Create data source connection to save your settings. The connection is created. The active window returns to the Data Sources main page, and the new connection appears in the list of data sources.
- Delete the data source connection by selecting the check box to the left of the title and then choosing Delete 1 connection. Selecting multiple check boxes for multiple connections is supported.
Editing and updating a data source connection
To make changes to the data source connection, select a connection in the list on the Data Sources main page. The Connection Details window opens.
To make changes to Connection Details, edit one or both of the Title and Description fields and select Save changes in the lower-right corner of the screen. You can also cancel changes here. To change the Authentication Method, choose a different authentication method, enter your credentials (if applicable), and then select Save changes in the lower-right corner of the screen. The changes are saved.
When Username & Password is the selected authentication method, you can update the password by choosing Update stored password next to the Password field. In the pop-up window, enter a a new password in the first field and then enter it again in the second field to confirm. Select Update stored password in the pop-up window. The new password is saved. Select Test connection to confirm that the connection is valid.
When AWS Sigv4 is the selected authentication method, you can update the credentials by selecting Update stored AWS credential. In the pop-up window, enter a new access key in the first field and a new secret key in the second field. Select Update stored AWS credential in the pop-up window. The new credentials are saved. Select Test connection in the upper-right corner of the screen to confirm that the connection is valid.
To delete the data source connection, select the trash can icon (![]() ).
).
Creating an index pattern
Use index patterns to access the OpenSearch data that you want to explore. Learn how to load your own data and create an index pattern in the following steps. This tutorial uses the preconfigured index pattern opensearch_dashboards_sample_data_ecommerce Default.
- In the Dashboards console, select Index Patterns and then Create index pattern.
- Select Use external data source connection.
- Start typing in the Search data sources field to search for the data source you created earlier and then select the data source and Next step.
- In the Dashboards console, choose Index Patterns and then Create index pattern.
- Choose Use external data source connection.
- Start typing in the Search data sources field to search for the data source you created earlier, select the data source, and then select Next step.
- Add an Index pattern name to define the index pattern and then choose Next step.
- Choose an option for the Time field and then select Create index pattern.
Searching data
Before you start searching for data, set up the time filter. The sample index pattern used for this tutorial contains time-based data. You can set a time filter that displays only the data within a specified time range, and you can choose the time filter to change the time range or select a specific time range in the histogram.
Setting the time filter
To set the time filter:
- In the Dashboards console, select Discover and confirm that the index pattern being used is
opensearch_dashboards_sample_data_ecommerce. - Select the calendar icon (
 ) to change the time field. The default time period is Last 15 minutes.
 - Change the time field to a particular time period, for example, Last 7 days, and then select Refresh.
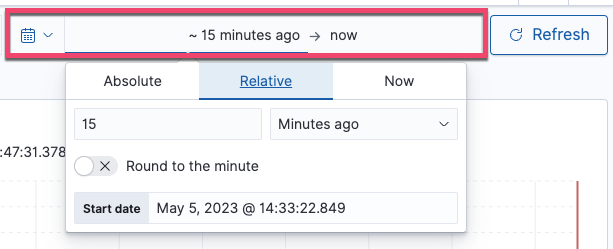
- Change start or end times by selecting the start or end time in the search bar.
- In the pop-up window, choose Absolute, Relative, or Now and then specify the date, for example, as shown in the following image.
Selecting a time range from the histogram
To select a time range for the histogram, choose from the following options:
- Select the bar that represents the time range you want to zoom in on.
- Select the bar and drag to view a specific time range. You must start the selection with the cursor over the background of the chart (the cursor changes to a plus sign when you hover over a valid start point).
- Select the dropdown and then select an interval.
Selecting multiple data sources in the Dev Tools console
Selecting multiple data sources in the Dev Tools console allows you to work with a broader range of data and gain deeper insight into your code and applications. Watch the video to see it in action, and then try it out in the following steps.
- Locate your copy of
opensearch_dashboards.ymland open it in the editor of your choice. - Set
data_source.enabledtotrue. - Connect to OpenSearch Dashboards and select Dev Tools in the menu.
-
Enter the following query in the editor pane of the Console and then select the play button:
GET /_cat/indices - From the DataSource dropdown menu, select a data source and then query the source.
- Repeat the preceding steps for each data source you want to select.
Creating data visualizations for a dashboard
To create data visualizations for a dashboard, follow these steps:
- In the Dashboards console, choose Visualize and then Create visualization.
- Select the visualization type. For this tutorial, choose Line.
- Select a source. For this tutorial, choose the index pattern
opensearch_dashboards_sample_data_ecommerce. - Under Buckets, choose Add and then X-axis.
- In the Aggregation field, choose Date Histogram and then choose Update.
- Choose Save and add the file name.
Connecting visualizations in a single dashboard
To connect your visualizations in a single dashboard, follow these steps:
- In the Dashboards console, choose Dashboard and then Create dashboard.
- Choose Add an existing and then select the data you want to add.
- Choose Save and add the dashboard name in the Title field. This tutorial uses preconfigured dashboards, so you won’t be able to save your dashboard.
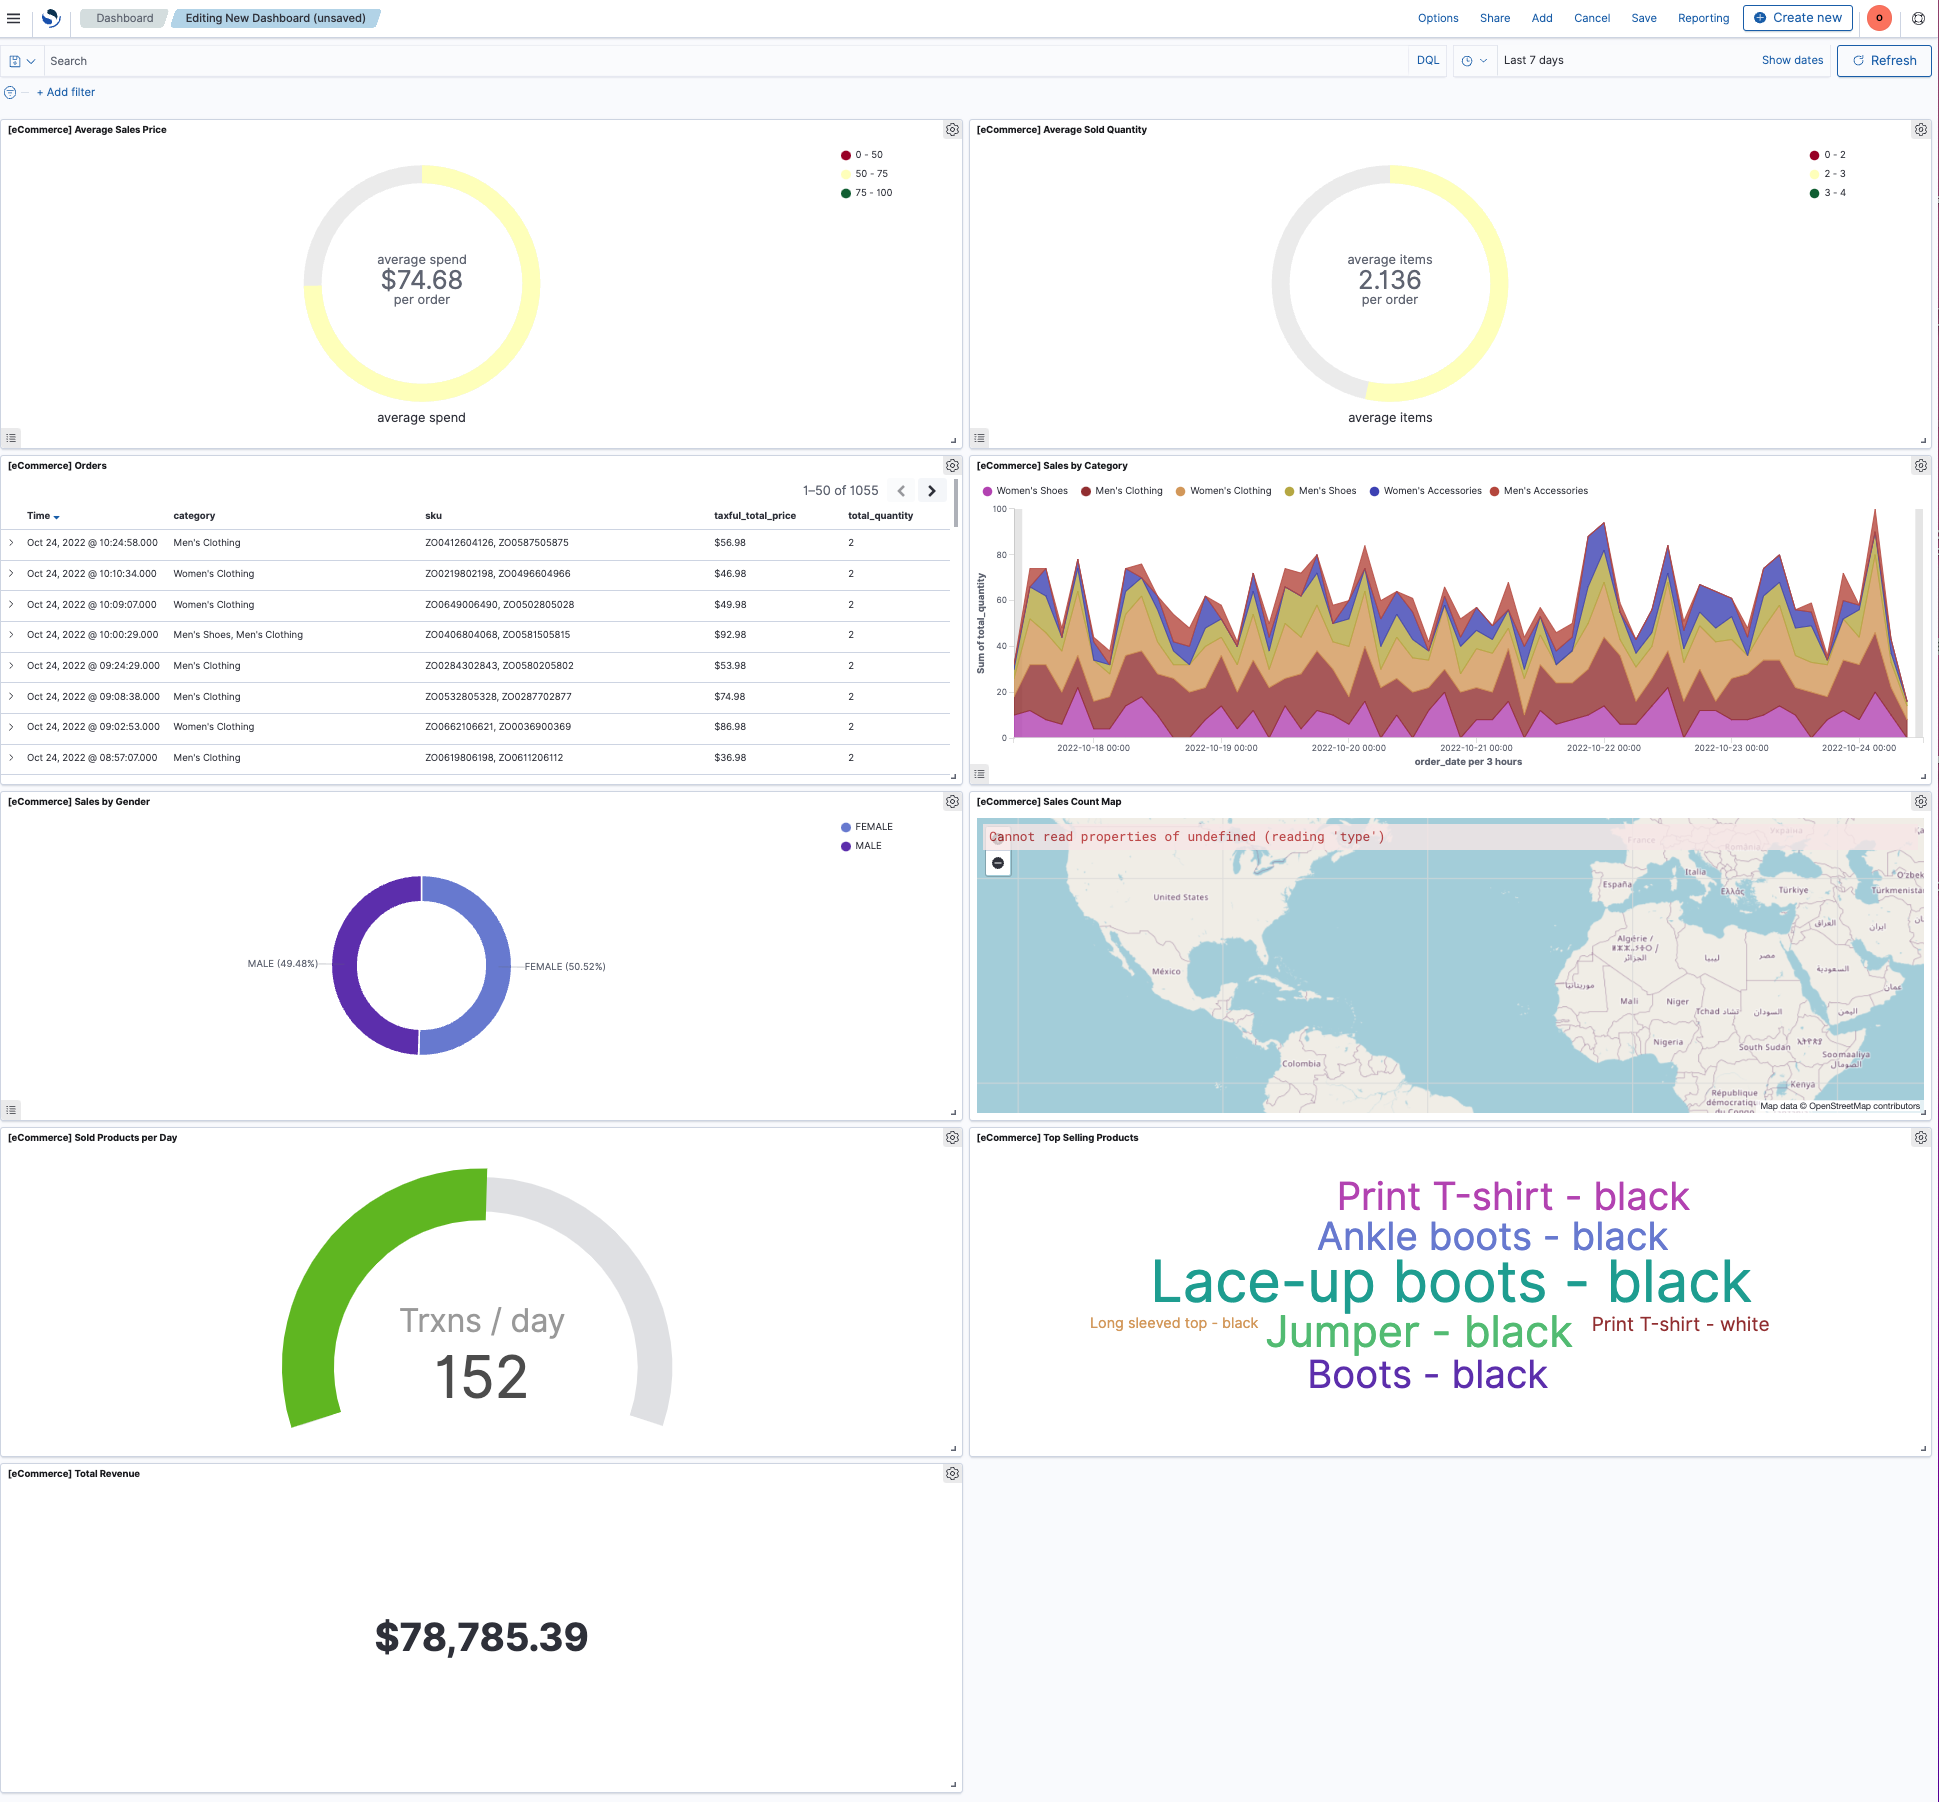
- Click on the white space left of Add panels to view the visualizations in a single dashboard.
Your dashboard might look like the one in the following image.
Understanding feature limitations
This feature has the following limitations:
- The multiple data sources feature is supported for index-pattern-based visualizations only.
- The visualization types Time Series Visual Builder (TSVB), Vega and Vega-Lite, and timeline are not supported.
- External plugins, such as Gantt chart, and non-visualization plugins, such as the developer console, are not supported.