You're viewing version 2.7 of the OpenSearch documentation. This version is no longer maintained. For the latest version, see the current documentation. For information about OpenSearch version maintenance, see Release Schedule and Maintenance Policy.
Creating detectors
Security Analytics provides the options and functionality to monitor and respond to a wide range of security threats. Detectors are the essential components that determine what to look for and how to respond to those threats. This section covers their creation and configuration.
Step 1. Define a detector
You can define a new detector by naming the detector, selecting a data source and detector type, and specifying a detector schedule. After defining a detector, you can also configure field mappings and set up alerts. Follow the steps in this section to accomplish all three of these setup tasks.
- On the Threat detectors page, choose Create detector. The Define detector page opens.
- In Detector details, give the detector a name. Adding a description for the detector is optional.
-
In the Data source section, select the dropdown arrow and select one or multiple sources for the log data.
When multiple data sources are selected, the logs must be of the same type. We recommend creating separate detectors for different log types.
-
In the Log types and rules section, select the log type for the data source. The Sigma security rules associated with the log data are automatically populated in the Detection rules section, as shown in the following image.
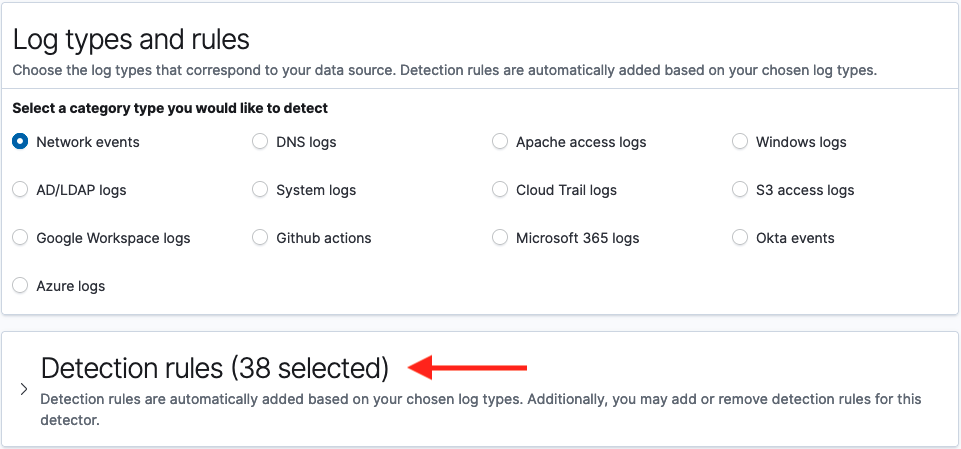
When selecting Network events, CloudTrail logs, or S3 access logs as the log type, a detector dashboard is automatically created. The dashboard offers visualizations for the detector and can provide security-related insight into log source data. For more information about visualizations, see Building data visualizations.
You can skip the next step for applying select rules if you are satisfied with those automatically populated by the system. Otherwise, go to the next step to select rules individually.
-
In the Detection rules section, specify only those rules you want applied to the detector, as shown in the following image.
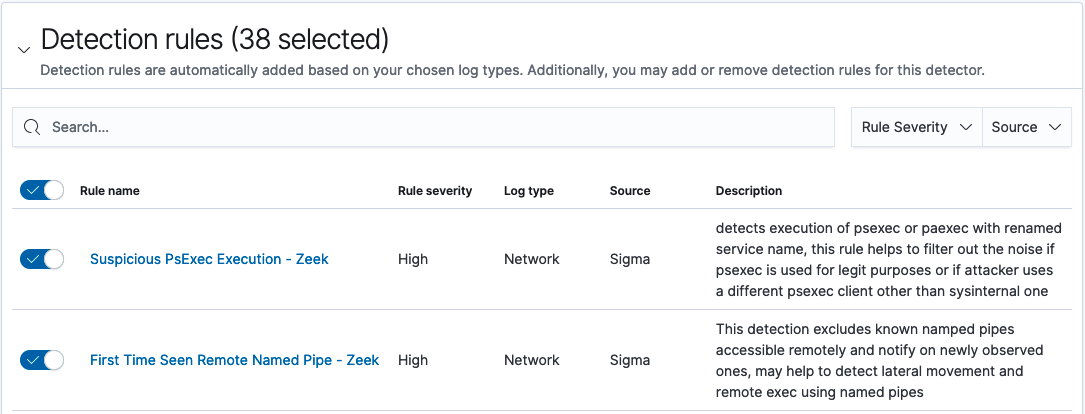
- Use the toggle to the left of Rule name to select or deselect rules.
- Use the Rule severity and Source dropdown lists to filter the rules you want to select from.
- Use the Search bar to search for specific rules.
To quickly select one or more known rules and dismiss others, first deselect all rules by moving the Rule name toggle to the left, then search for your target rule names and select each individually by moving its toggle to the right.
- In the Detector schedule section, set how often the detector will run. Specify a unit of time and a corresponding number to set the interval.
- Choose Next in the lower-right corner of the screen to continue. The Configure field mapping page appears.
Step 2. Create field mappings
The field mapping step matches field names from the rule with field names from the log index being used to provide data. Creating field mappings allows the system to accurately pass event data from the log to the detector and then use the data to trigger alerts.
The data source (log index), log type, and detection rules specified in the first step determine which fields are available for mapping. For example, when “Windows logs” is selected as the log type, this parameter, along with the specific detection rules, determines the list of rule field names available for the mapping. Similarly, the selected data source (log index) determines the list of log source field names that are available for the mapping.
Because the system uses prepackaged Sigma rules for detector creation, it can automatically map important fields for a specific log type with the corresponding fields in the Sigma rules. The field mapping step presents a view of automatically mapped fields while also providing the option to customize, change, or add new field mappings. When a detector includes custom rules, you can follow this step to manually map rule field names to log source field names.
A note on field names
The field mapping process requires that you are familiar with the field names in the log index and have an understanding of the data contained in those fields. If you have an understanding of the log fields in the index, the mapping is typically a straightforward process.
Security Analytics takes advantage of prepackaged Sigma rules for security event detection. Therefore, the field names are derived from a Sigma rule field standard. To make them easier to identify, however, we have created aliases for the Sigma rule fields based on the open-source Elastic Common Schema (ECS) specification. These alias rule field names are the field names used in these steps. They appear in the Detector field name column of the mapping tables.
Although the ECS rule field names are largely self-explanatory, you can find predefined mappings of the Sigma rule field names to ECS rule field names, for all supported log types, in the GitHub Security Analytics repository. Navigate to the OSMappings folder, choose the folder named for the log type, and open the fieldmappings.yml file. For example, to see the Sigma rule fields that correspond to ECS rule fields for the Windows log type, open the fieldmappings.yml file in the windows folder.
Automatically mapped fields
Once you navigate to the Configure field mapping page, the system attempts to automatically map fields between the two sources. The Automatically mapped fields table contains mappings that the system created automatically after defining the detector. When the field names are similar to one another, the system can successfully match the two, as shown in the following image.
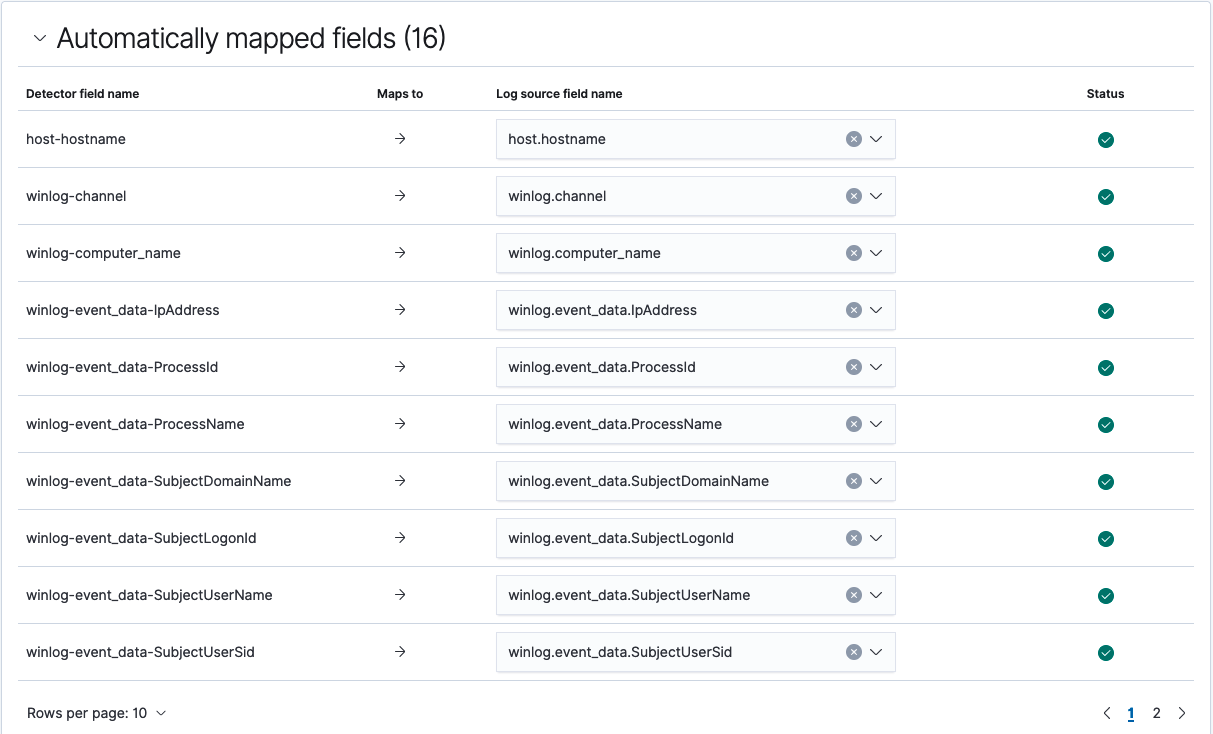
Although these automatic matches are normally dependable, it’s still a good idea to review the mappings in the Automatically mapped fields table and verify that they are correct and matched as expected. If you find a mapping that doesn’t appear to be accurate, you can use the dropdown list to search for and select the correct field name. For more on matching field names, see the Pending field mappings section that follows.
Pending field mappings
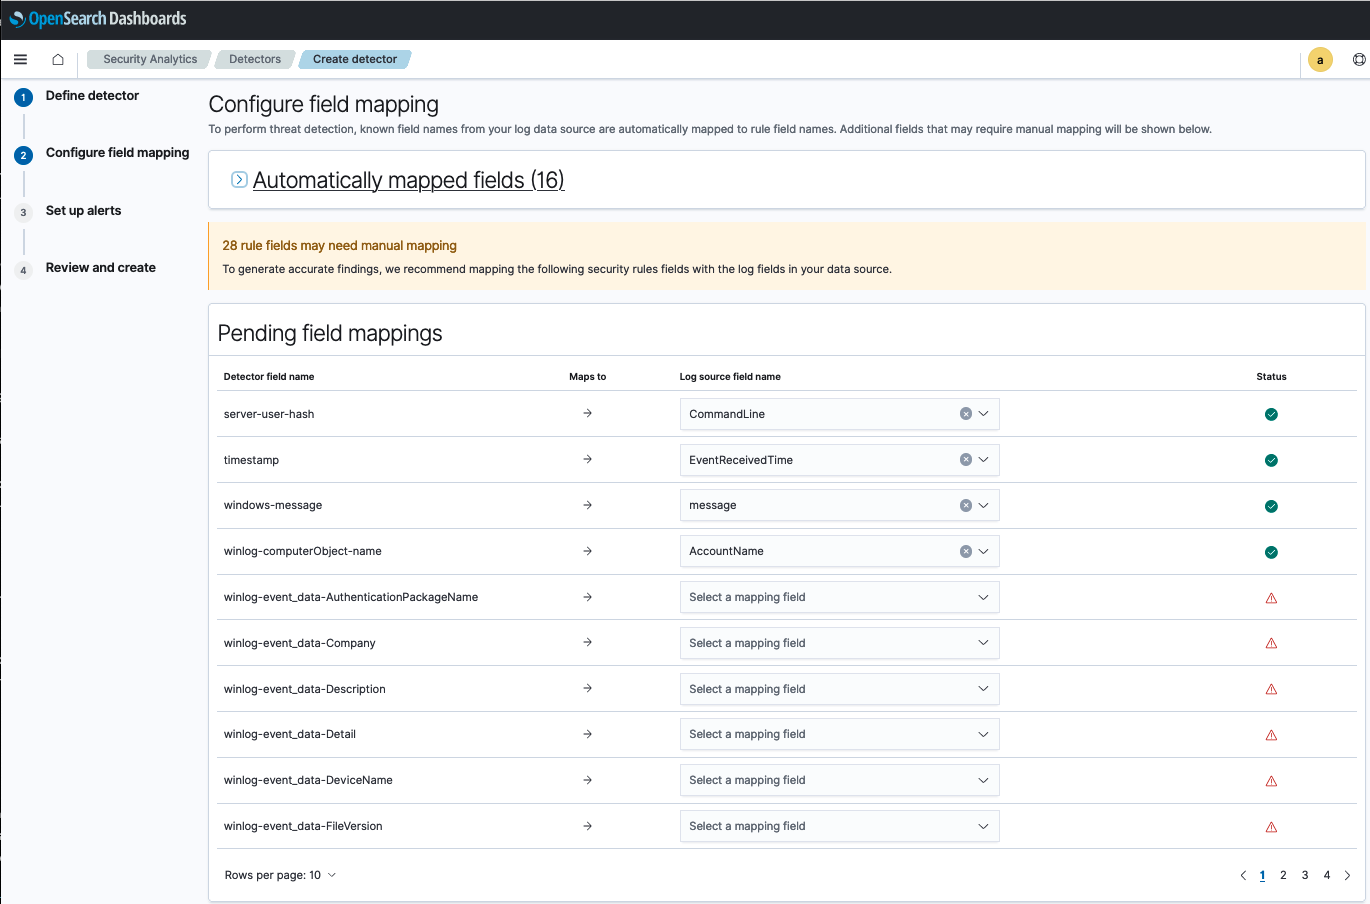
The field names that are not automatically mapped appear in the Pending field mappings table. In this table you can manually map rule fields to log source fields, as shown in the following image.
While mapping fields, consider the following:
- The Detector field name column lists field names based on all of the prepackaged rules associated with the selected log type.
- The Log source field name column includes a dropdown list for each of the detector fields. Each dropdown list contains field names extracted from the log index.
- To map a detector field name to a log source field name, use the dropdown arrow to open the list of log source fields and select the log field name from the list. To search for names in the log field list, enter text in the Select a mapping field box, as shown in the following image.
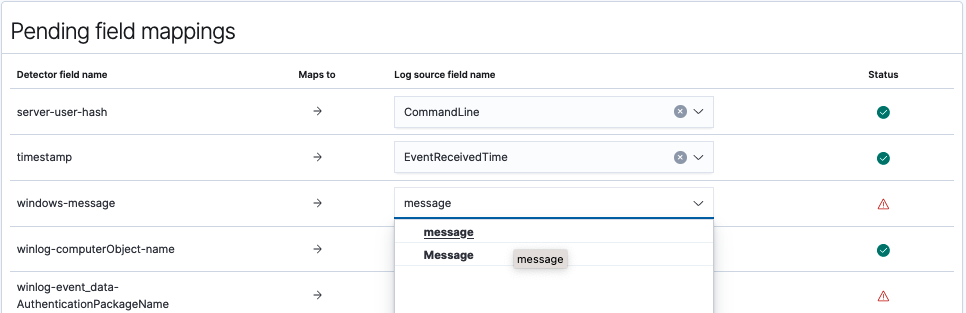
- Once the log source field name is selected and mapped to the detector field name, the icon in the Status column to the right changes to a green check mark.
- Make as many matches between field names as possible to complete an accurate mapping for the detector and log source fields.
After completing the mappings, choose Next in the lower-right corner of the screen. The Set up alerts page appears and displays settings for an alert trigger.
Step 3. Set up alerts
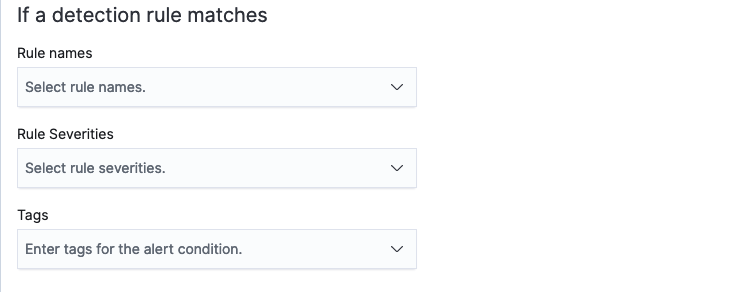
The third step in creating a detector involves setting up alerts. Alerts are configured to create triggers that, when matched with a set of detection rule criteria, send a notification of a possible security event. You can select rule names, rule severity, and tags in any combination to define a trigger. Once a trigger is defined, the alert setup lets you choose the channel on which to be notified and provides options for customizing a message for the notification.
At least one alert condition is required before a detector can begin generating findings.
You can also configure alerts from the Findings window. To see how to set up alerts from the Findings window, see The findings list. A final option for adding additional alerts is to edit a detector and navigate to the Alert triggers tab, where you can edit existing alerts as well as add new ones. For details, see Editing a detector.
To set up an alert for a detector, continue with the following steps:
- In the Trigger name box, enter a name for the trigger.
-
To define rule matches for the alert, select security rules, severity levels, and tags.
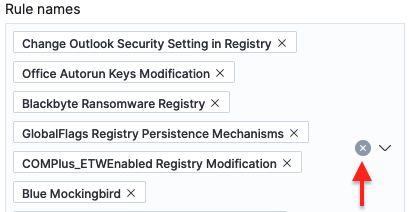
- Select one rule or multiple rules that will trigger the alert. Put the cursor in the Rule names box and type a name to search for it. To remove a rule name, select the X beside the name. To remove all rule names, select the X beside the dropdown list’s down arrow.
- Select one or more rule severities as conditions for the alert.
- Select from a list of tags to include as conditions for the alert.
-
To define a notification for the alert, assign an alert severity, select a channel for the notification, and customize a message generated for the alert.
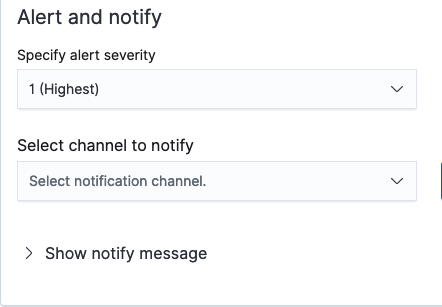
- Assign a level of severity for the alert to give the recipient an indication of its urgency.
- Select a channel for the notification. Examples include Slack, Chime, or email. Select the Manage channels link to the right of the field to link the notification to a preferred channel.
- Select the Show notify message label to expand message preferences. You can add a subject for the message and a note to inform recipients of the nature of the message.
- After configuring the conditions in the preceding fields, select Next in the lower-right corner of the screen. The Review and create page opens.
After reviewing the specifications for the detector, choose Create in the lower-right corner of the screen to create the detector. The screen returns to the list of all detectors, and the new detector appears in the list.
What’s next
If you are ready to view findings for the new detector, see the Working with findings section. If you would like to import rules or set up custom rules before working with findings, see the Working with rules section.