You're viewing version 2.9 of the OpenSearch documentation. This version is no longer maintained. For the latest version, see the current documentation. For information about OpenSearch version maintenance, see Release Schedule and Maintenance Policy.
OpenSearch Integrations
Introduced 2.9
OpenSearch Integrations is a straightforward starting point that OpenSearch and OpenSearch Dashboards users can use to visualize and understand log and metric data for a particular resource, such as NGINX. An integration contains a bundle of metadata, data mappings, and visualizations that make it simple to monitor data from the Integrations resource.
The OpenSearch Project seeks your feedback on this feature. Let us know on the OpenSearch forum how OpenSearch Integrations works for you or how it can be improved.
Setting up OpenSearch Integrations
For the latest developer information, including sample code, articles, tutorials, and an API reference, see the following resources:
- Integrations repository on GitHub
- Integration Creation Guide
- Integration Documentation Reference
- Observability plugin for OpenSearch Dashboards
Integrations schema
The OpenSearch Integrations schema outlines how to capture, analyze, and visualize data. It includes the selection and configuration of monitoring tools, data collection methods, data storage and retention strategies, and visualization and alerting mechanisms. It follows the OpenTelemetry Protocol convention, with OpenSearch Simple Schema for Observability handling the translation from the OpenTelemetry (OTel) schema to the physical index mapping templates.
Find detailed information about the schema, including schema examples, in the OpenSearch Observability READ.me file and on the OpenSearch Observability wiki.
Get started
Using the OpenSearch Dashboards interface, you can connect your data, applications, and processes so that you can centrally manage the services you use. All integrations are available in a single view, and OpenSearch Dashboards guides you there from the home page and main menu.
Learn how to do the following using the OpenSearch Dashboards interface:
- Access integrations
- View integrations
- Add integrations
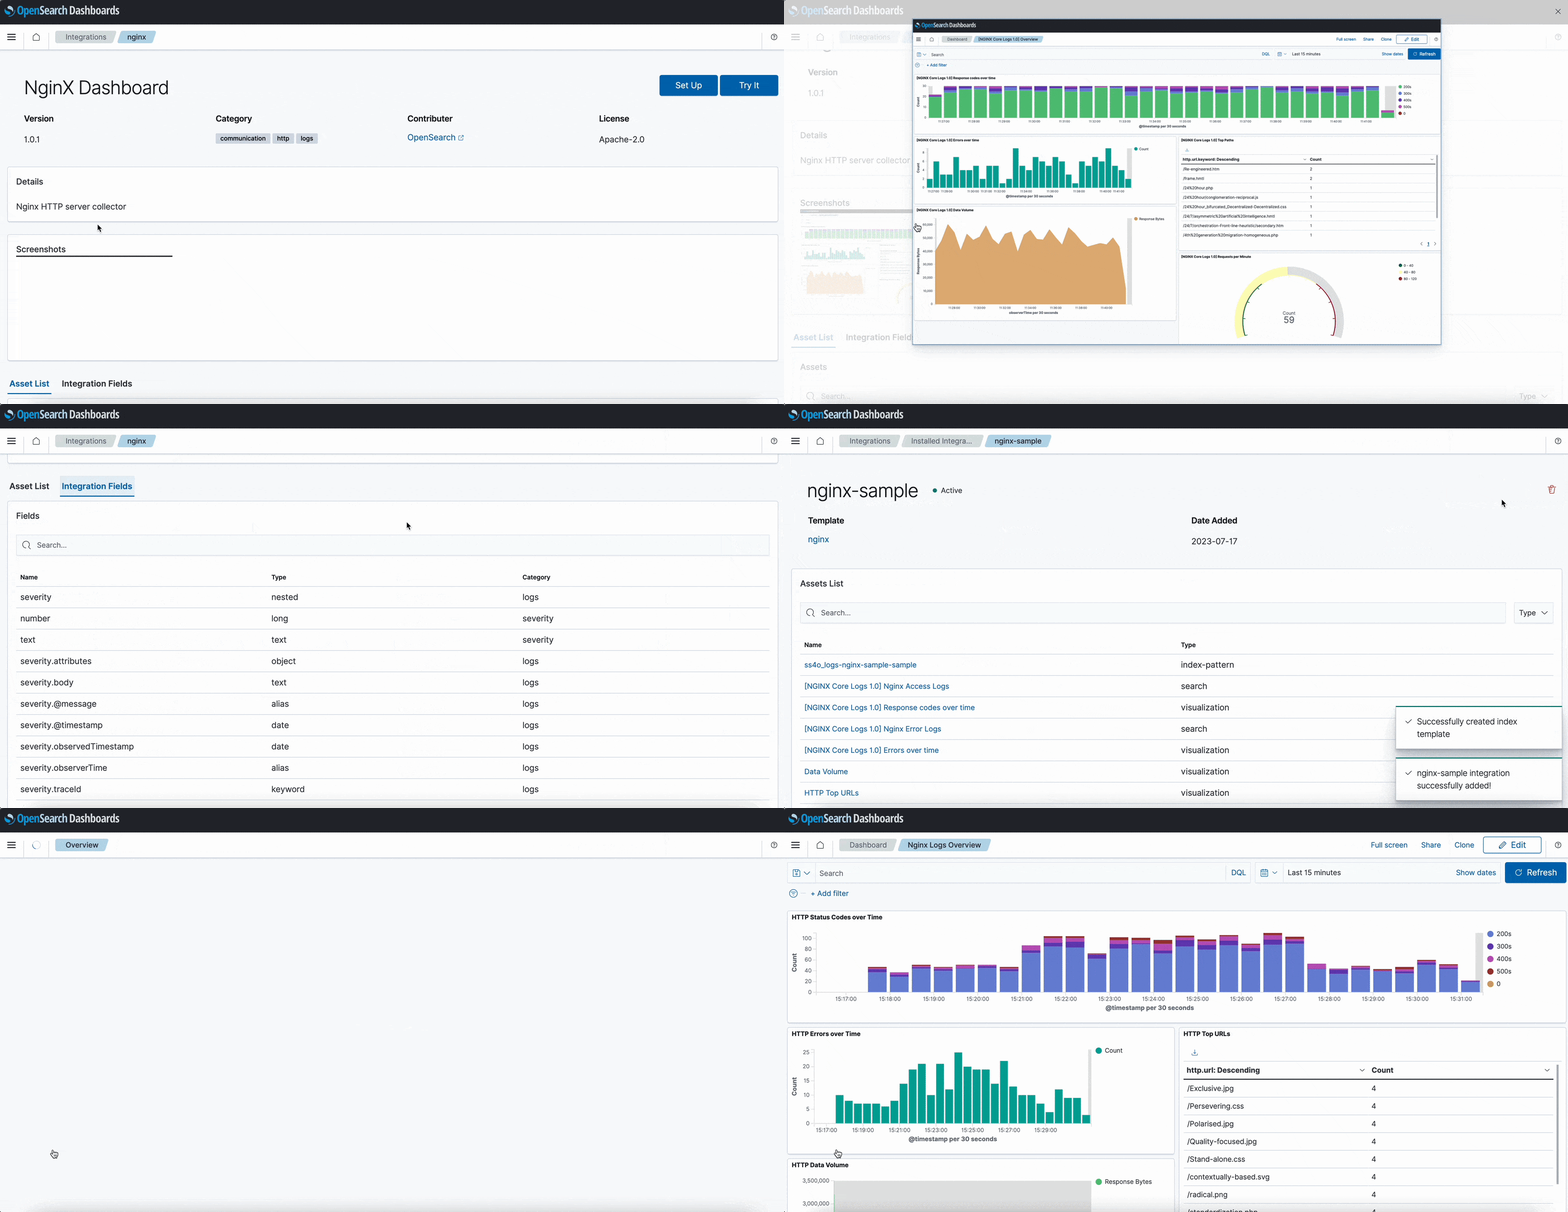
The following image gives you a snapshot of the Integrations interface:

Access integrations
To access integrations, open OpenSearch Dashboards and select Integrations from the Management menu. The interface displays installed and available integrations.
View integrations
To view an integration, view the dashboard associated with the integration. If the integration doesn’t have an associated dashboard, select the desired integration listed under the Installed window. View the integration details, such as assets and fields.
Add integrations
If you have not installed any integrations, you’ll be prompted to install them from the Integrations interface. Supported integrations are listed in the Available window.
To add an integration, select the desired prepackaged assets. Currently, OpenSearch Integrations has two flows: Add or Try it. The following example uses the Try it flow:
- On the Integrations page, select NginX Dashboard.
- Select the Try it button. The Try it flow automatically creates a sample index template, adds sample data to the template, and then creates the integration based on that data.
- View the asset list and select a dashboard asset.
- Preview the data visualizations and sample data details.