Given the increasing demand for artificial intelligence (AI), the obvious evolution of the dashboard user experience is the development of an intelligent assistant. User experience relies predominantly on the maturity of the design experience, which is based on six levels of development. As defined by Nielsen, this process of evolution delineates the presence of UX across several states: absent, limited, emergent, structured, integrated, and, finally, the most desired state of being user driven (see UX maturity covers processes, design, research, leadership support, and longevity of UX in product design).
Key considerations
When a user consumes dashboard data, their end goal is to interpret data in a way that aids effective business decision-making. Motivations that drive the dashboard user’s UX preferences are often different from motivations that drive dashboard producers (developers or data scientists who create dashboards) in setting up visualizations. Another useful context for dashboard consumption is whether the user accesses the visualization tool proactively (for monitoring, to establish compliance, or to set up a new platform) or reactively (in alerting use cases, in the event unusual activity needs to be investigated, or when data breaches occur). However, the most pressing concerns for log analysts are internal threats to data, social engineering, anomalies in security monitoring, triggered firewalls, and threat engineering. These situations require log and security analytics tools that engage users in a meaningful experience.
Terms and expectations
Product managers and designers should consider user expectations in developing a dashboard solution that not only addresses the user’s unique business challenges but also provides them with a user experience that enables proper visualization of their data. When developing software, it is important to have an understanding of how tone, mode, customization, and personalization are perceived by users. Ultimately, when developing an AI assistant, understanding what contributes to user trust in an AI assistant is vital. Given that OpenSearch is used to power log analytics solutions created by developers (dashboard producers), we reached out to recruit them via our bi-monthly community meetings. We recruited seven developers who were also dashboard producers and two solutions architects. We shared our findings at the recent Graylog GO 2023 user conference in Houston.
Producers expressed less interest in curating the interaction between an AI assistant and a user and focused more on ensuring user trust in AI results. They offered suggestions such as proxies, increasing user trust with accuracy metrics, displaying the data models used to produce results, and user ratings for commonly displayed results. Moreover, producers were more interested in how an AI assistant could help them.
They wanted an AI assistant to help with queries by translating them to visualizations, providing links to the best documentation, offering suggestions on building better dashboards, offering insights on monitoring visualization and dashboard usage, and providing assistance with finding, structuring, and visualizing data. They also expressed the potential usefulness of an AI assistant in offering suggestions regarding the implementation of advanced analytics, such as alerting and anomaly detection. When pressed on their end user interaction and their role in curating the experience, producers took a hands-off approach. While they did express strong skepticism that their users would trust the AI assistant, they also offered overall feedback on methods of engendering user trust, such as visuals, boosting confidence in accuracy and relevance, and other user-guided customizations.
Talking to AI
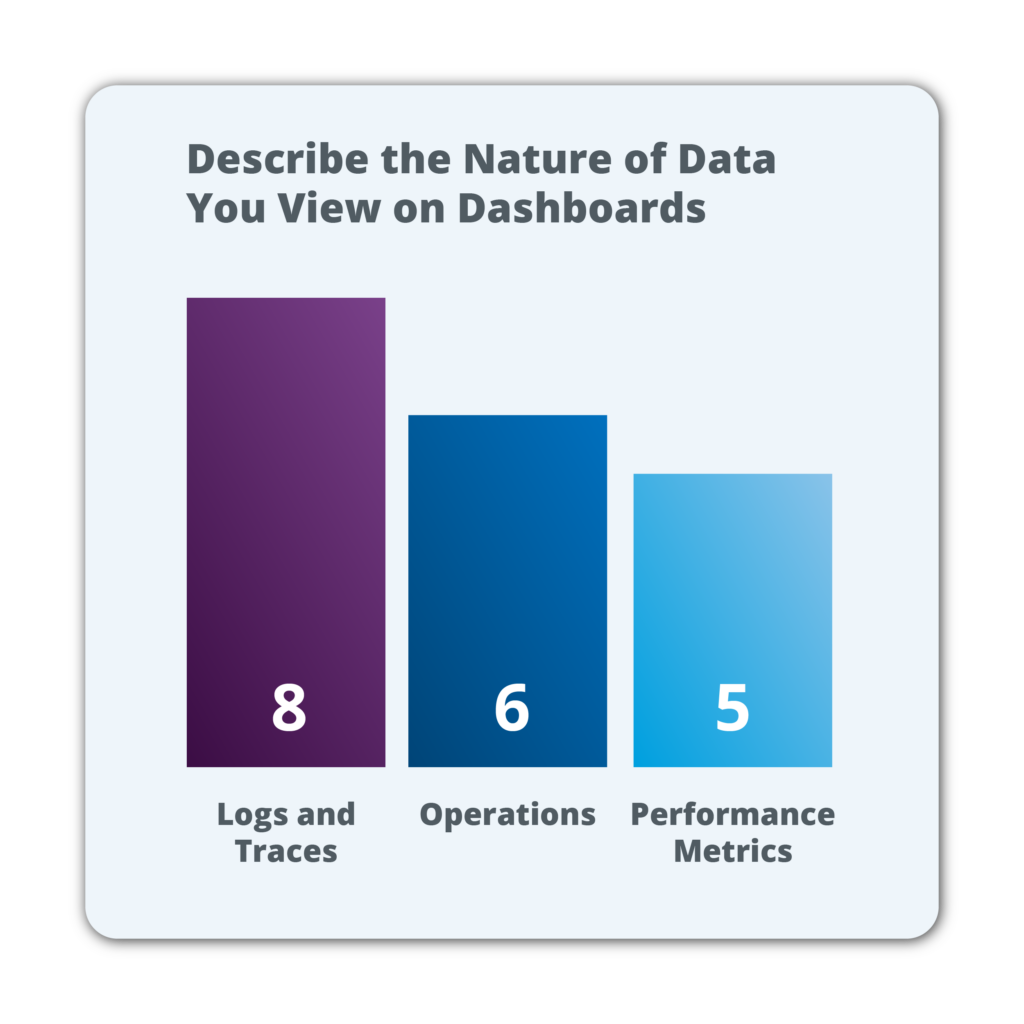
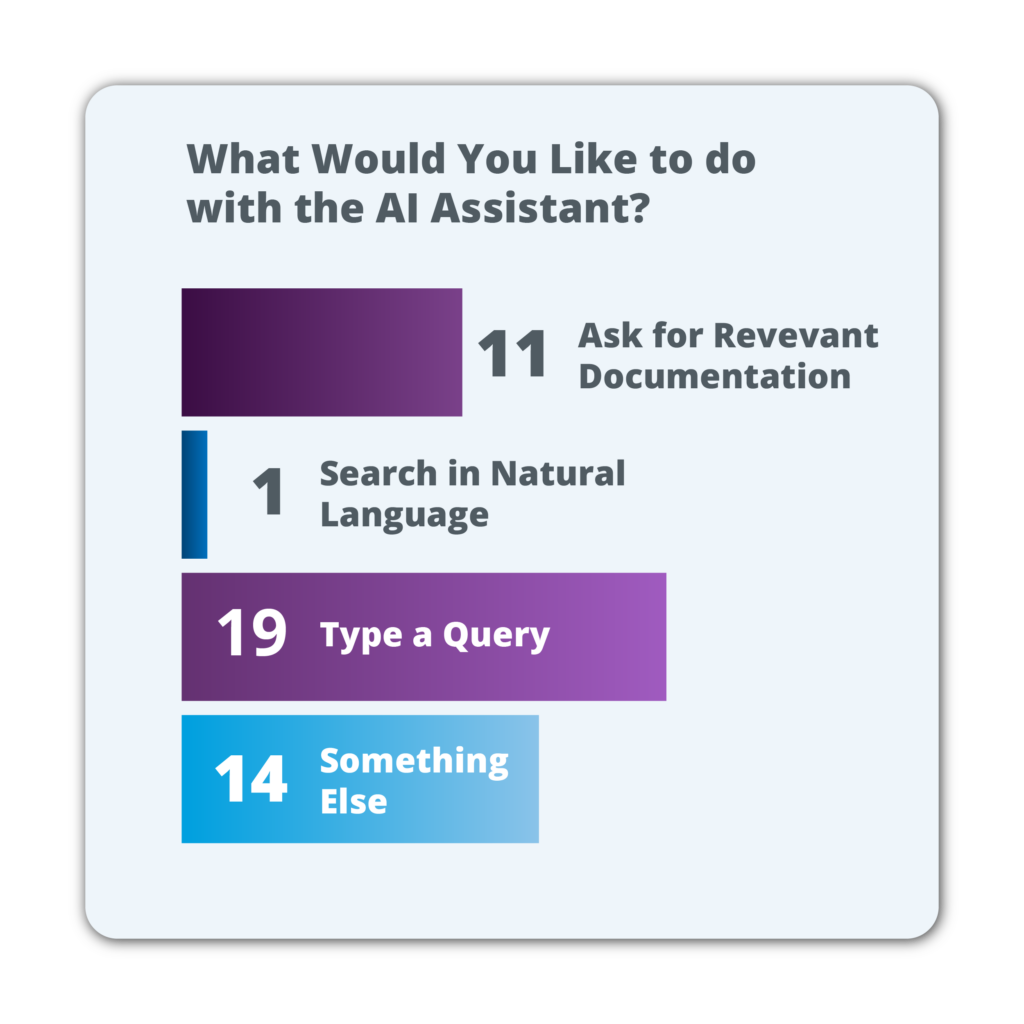
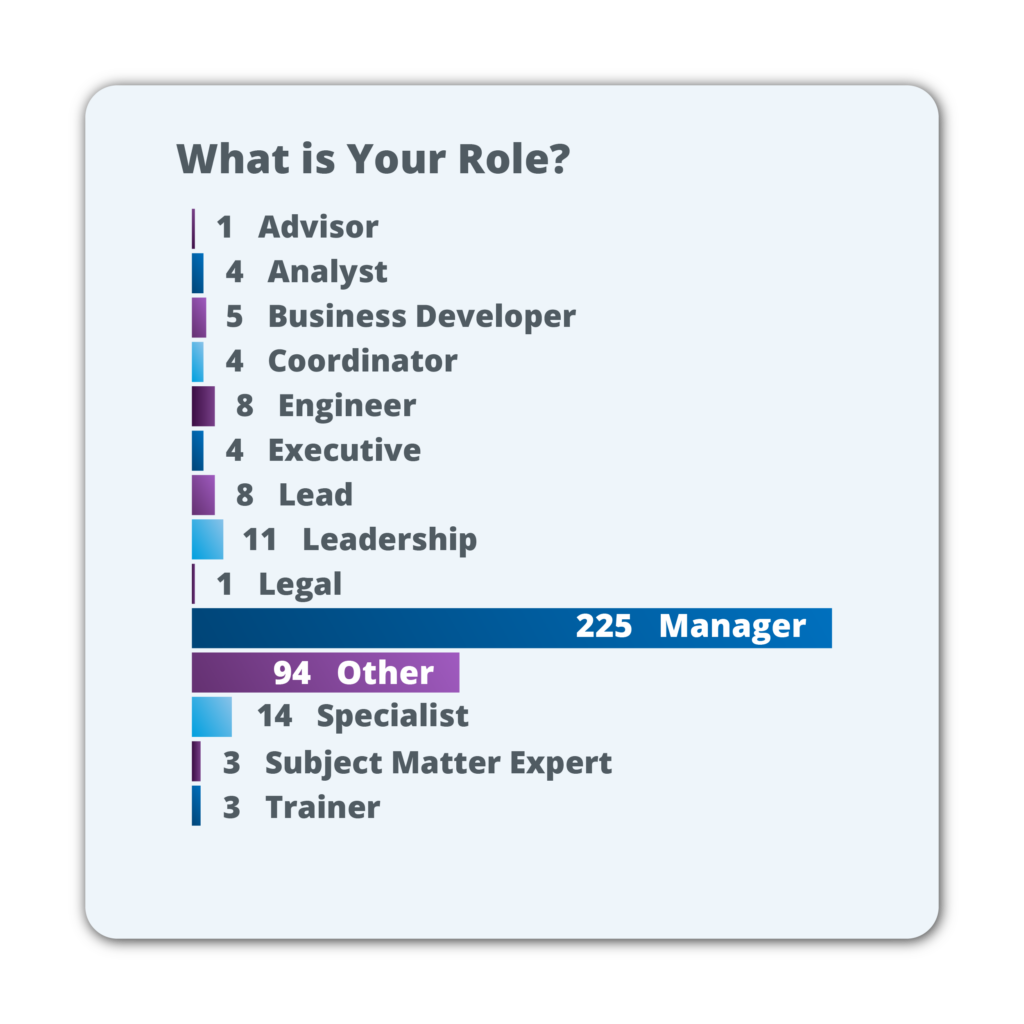
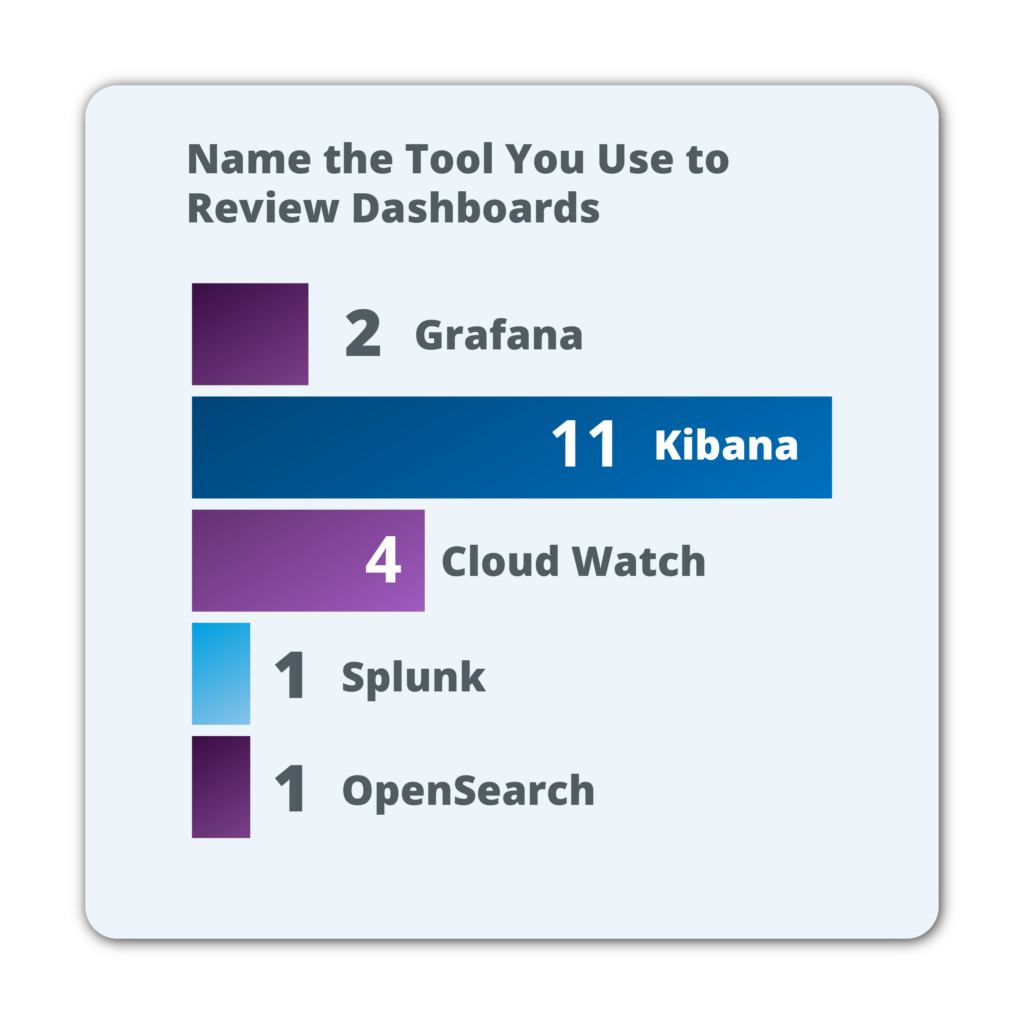
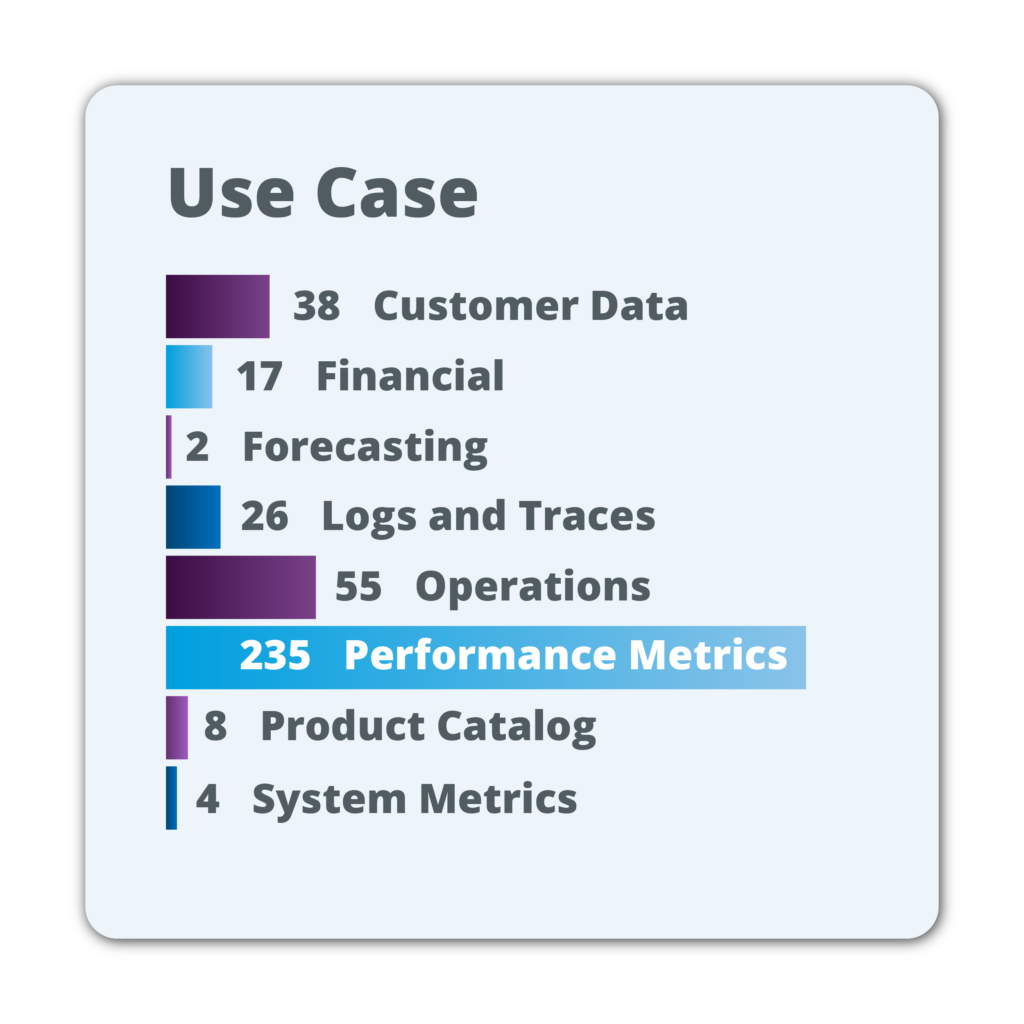
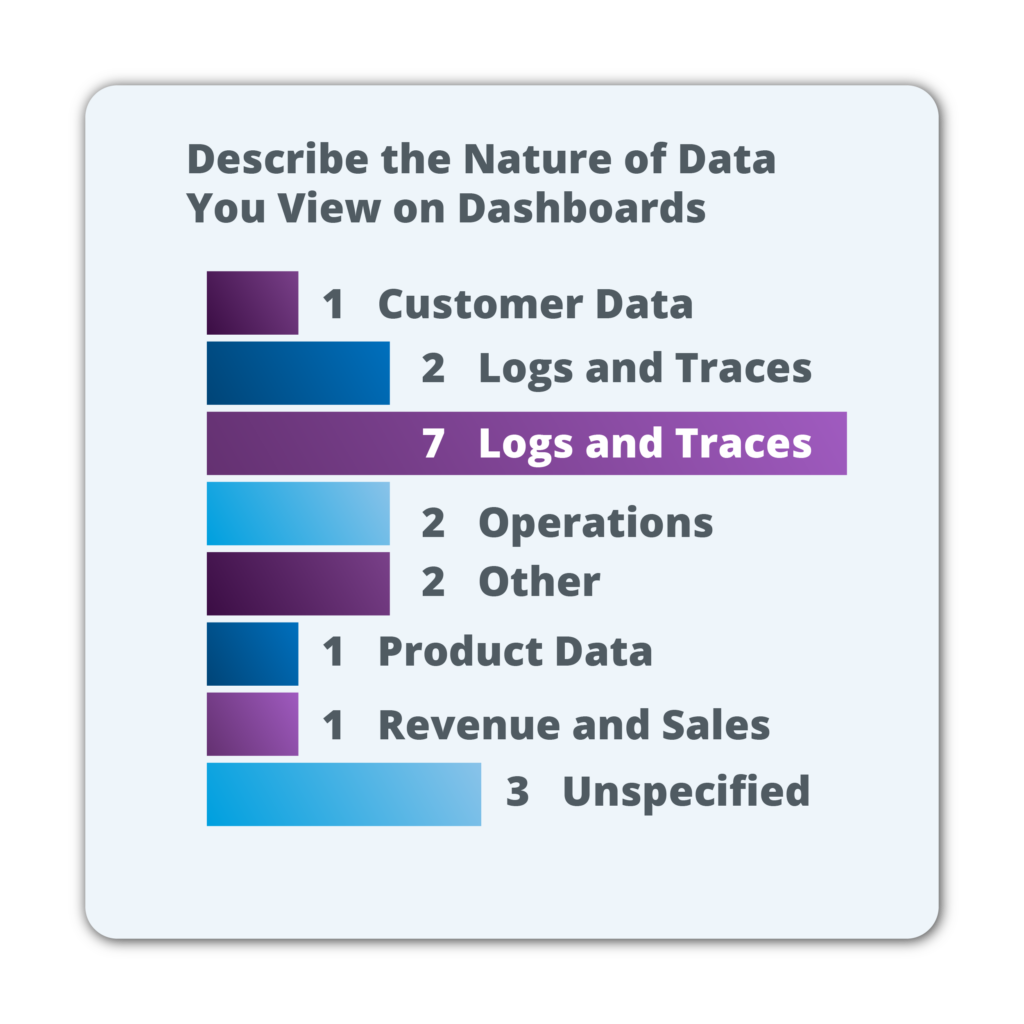
Given the results of our interviews with producers, we realized the importance of understanding how end users would determine the requirements of an AI assistant and how to best curate an experience for them. We assimilated results from 385 dashboard users. The tools they used included Kibana, Grafana, OpenSearch, Tableau, and QuickSight. We first analyzed feedback from log analytics users, 57.8% of whom were Kibana users. They indicated that they predominantly (42.1%) used logs and traces. When asked about what they would like to do with an AI assistant, all of them (100%) indicated that they would use an AI assistant in a query, and 57.8% of them indicated that they would use an AI assistant to find relevant documentation. For design and UX insights, we drew inferences from the larger sample.
Use cases
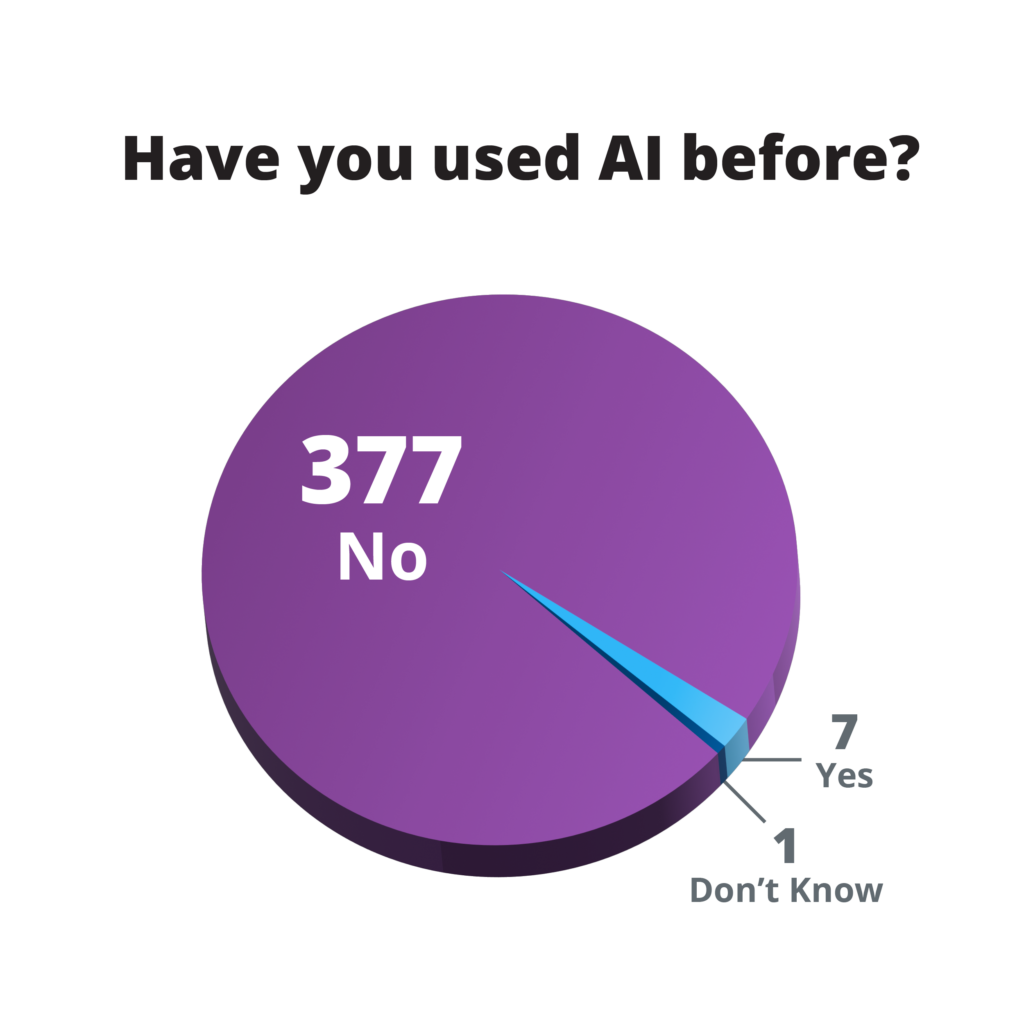
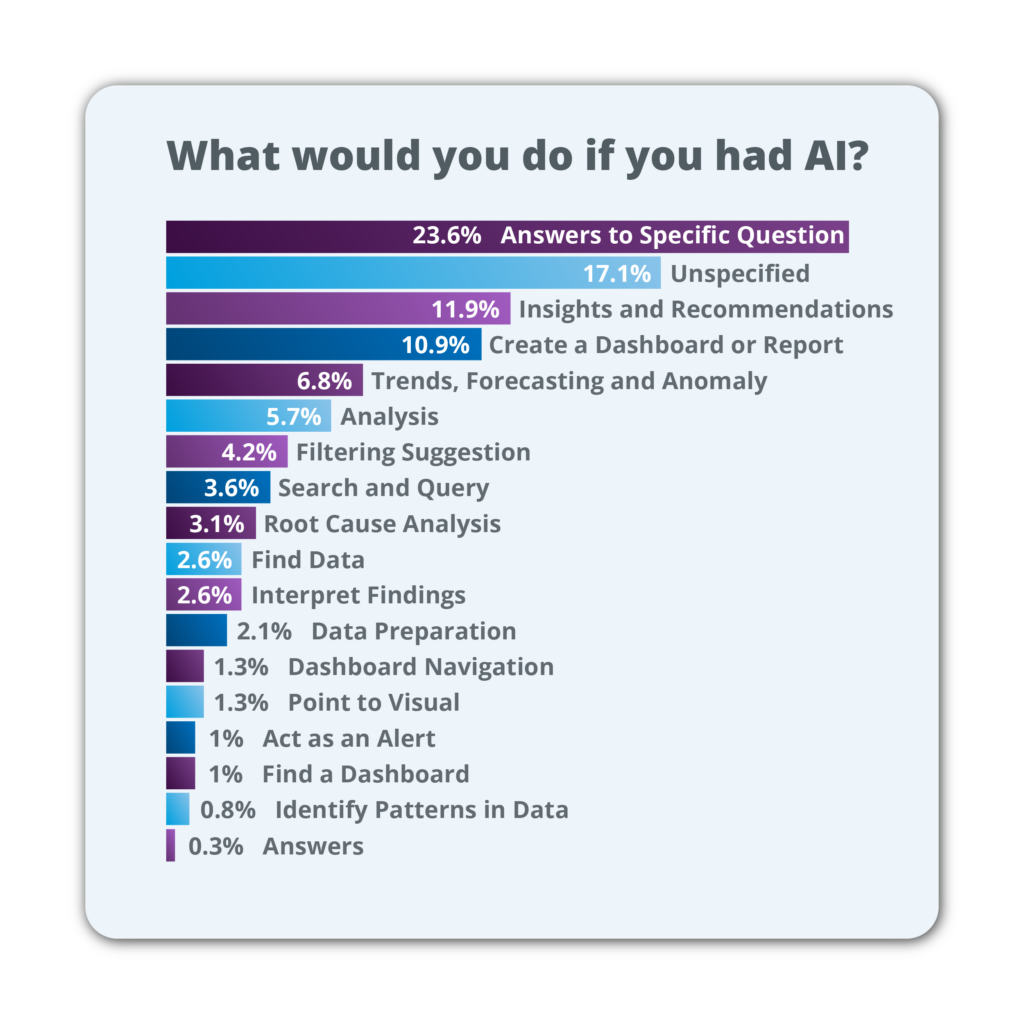
When asked if they had used AI on a dashboard before, most users (97.9%) indicated that they had not. Around a third (32.2%) of dashboard users indicated that they had used dashboards to monitor metrics. Around a quarter (23.4%) indicated that they had used an AI assistant to answer a specific question. Other use cases included obtaining insights and recommendations on creating a dashboard or visualization, help with drilldowns and applying filters, help finding visualizations, dashboards, and data, and help interpreting findings and identifying patterns in data.
Visual preferences
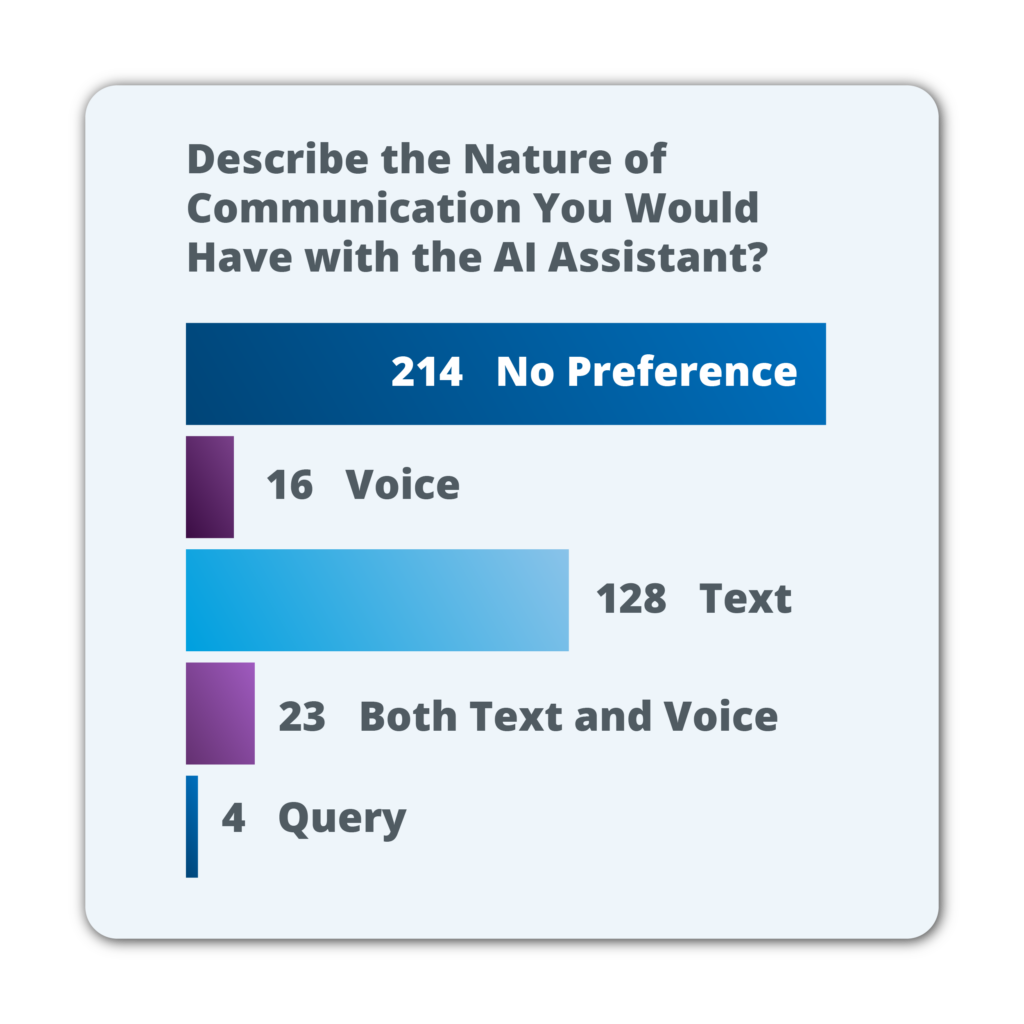
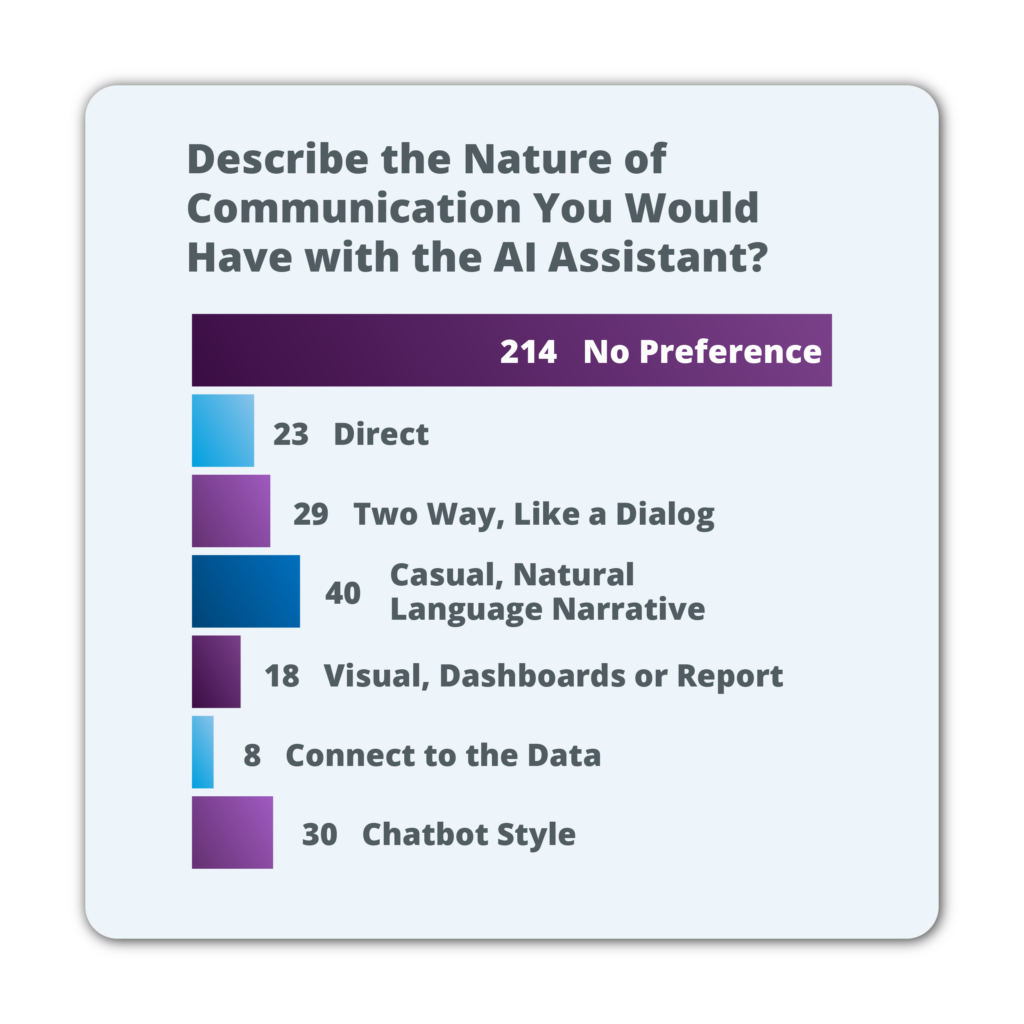
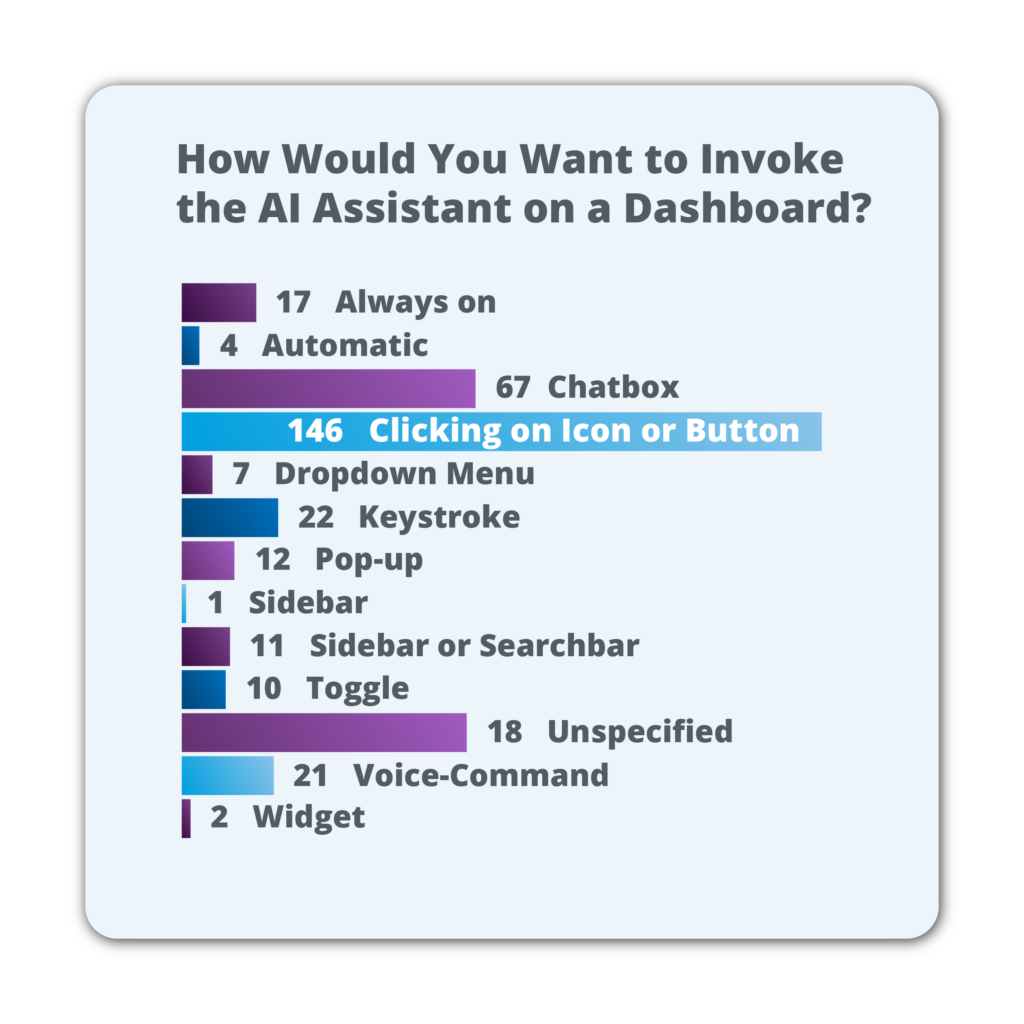
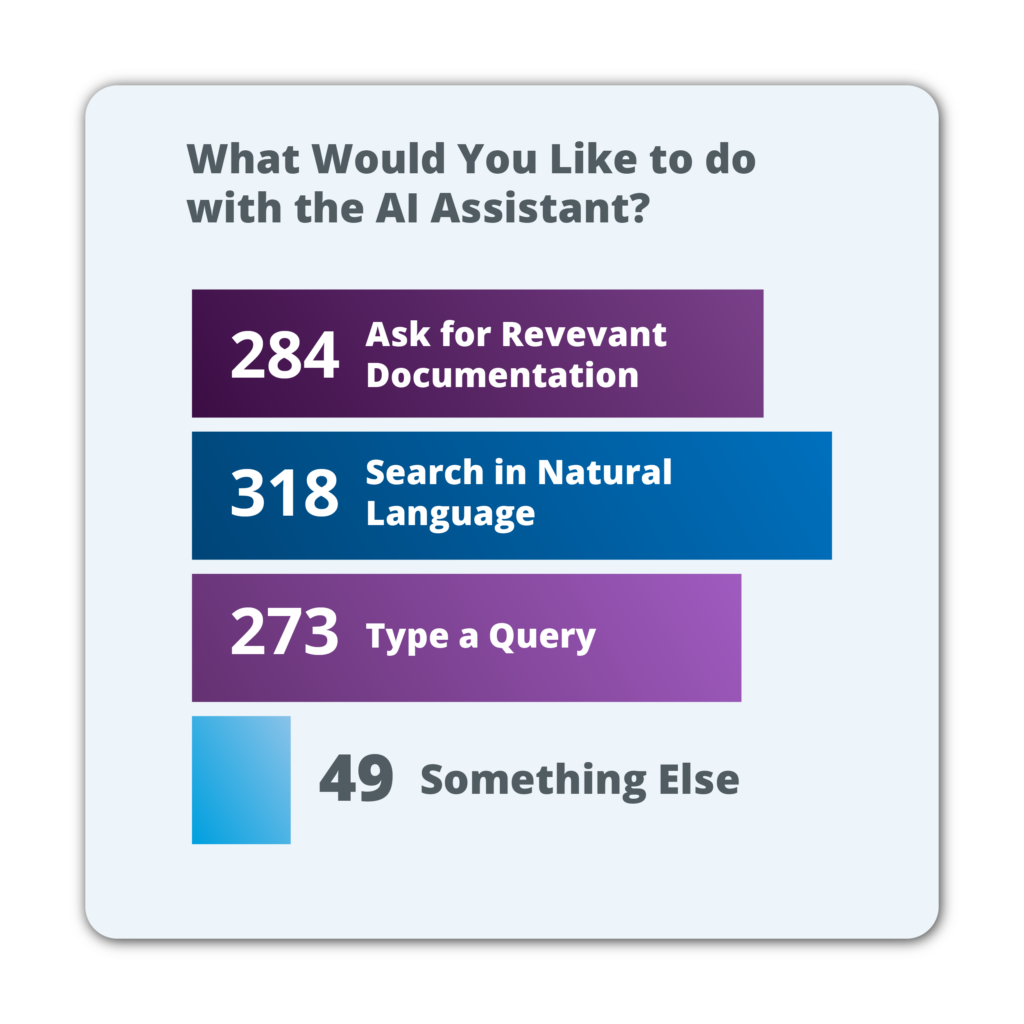
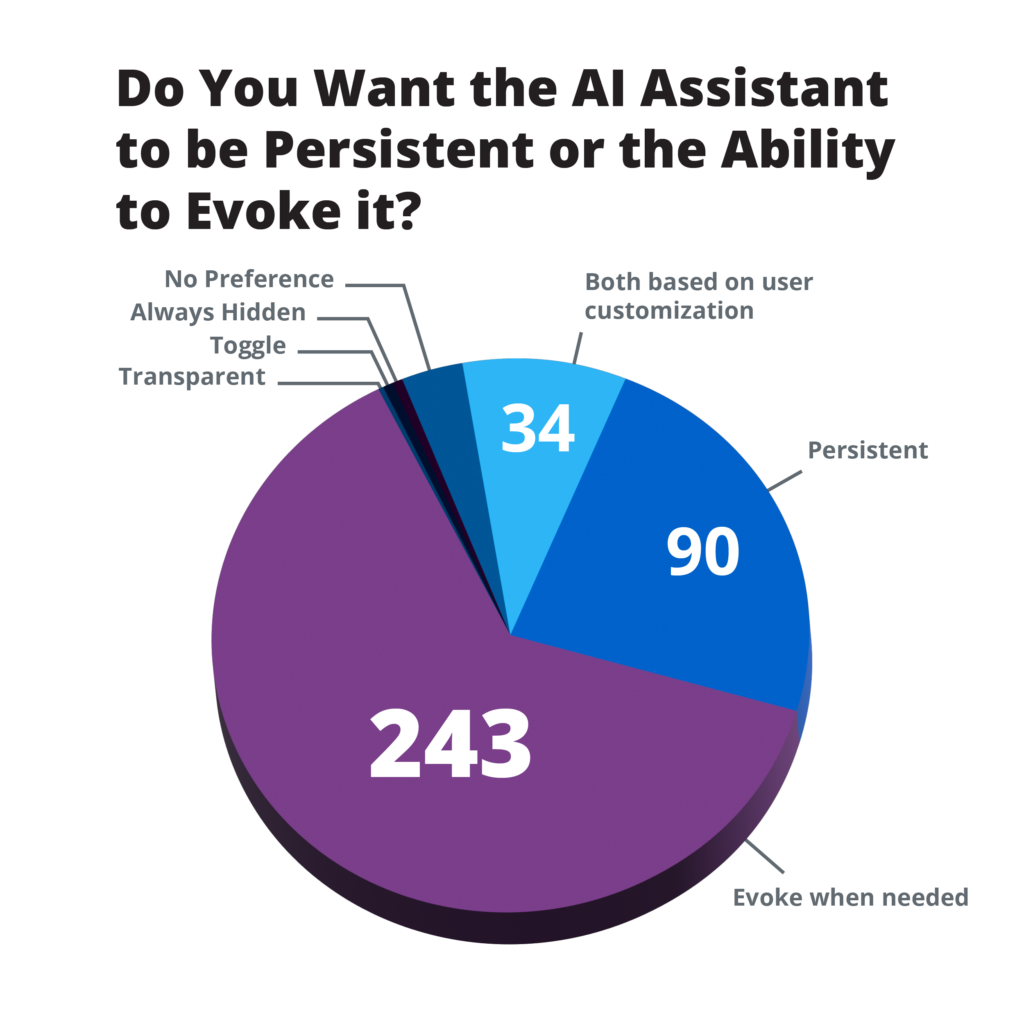
Most users (63.1%) wanted to invoke an AI assistant only when needed rather than it being in a persistent state. 37.9% wanted to invoke an assistant by selecting an icon or button, and 82.5% wanted to converse with an AI assistant in natural language. Dashboard users also wanted to use an AI assistant to ask for relevant documentation (73.7%) and to input a query (70.9%).
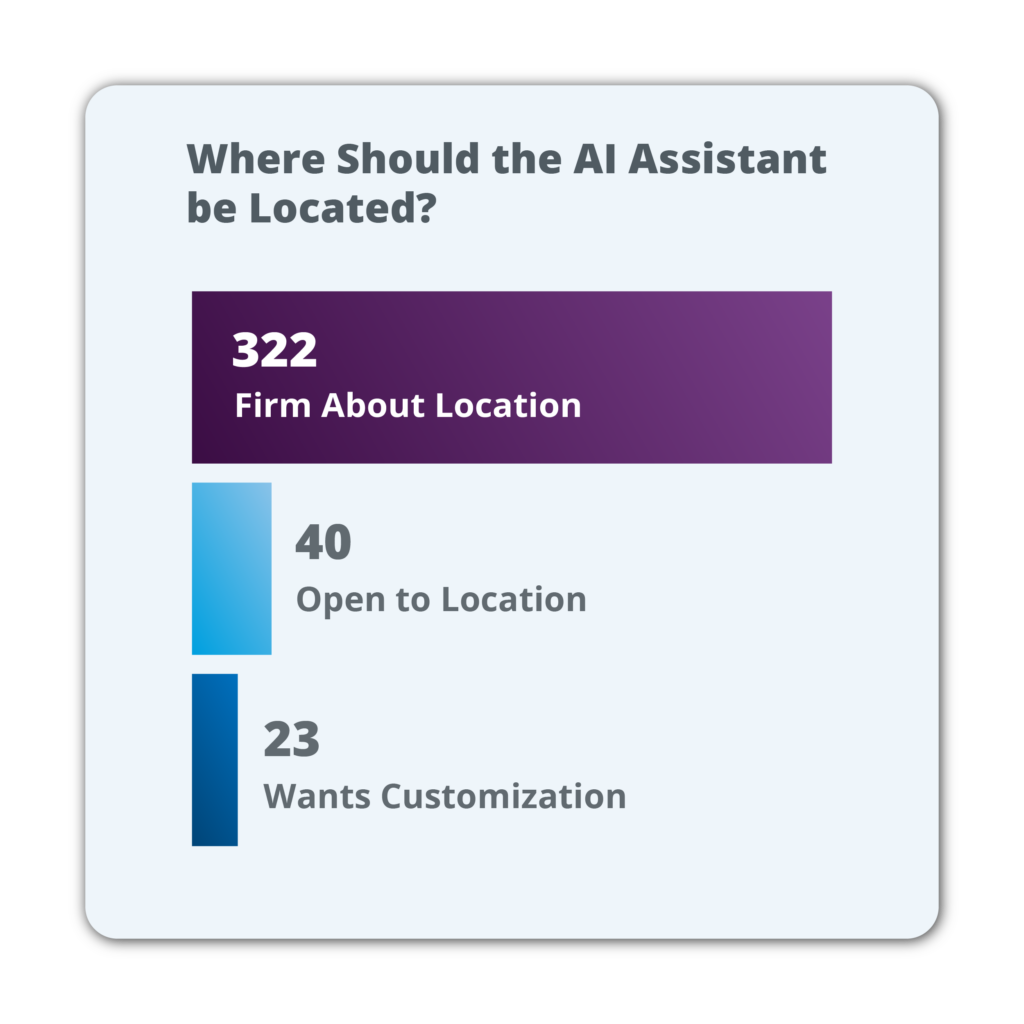
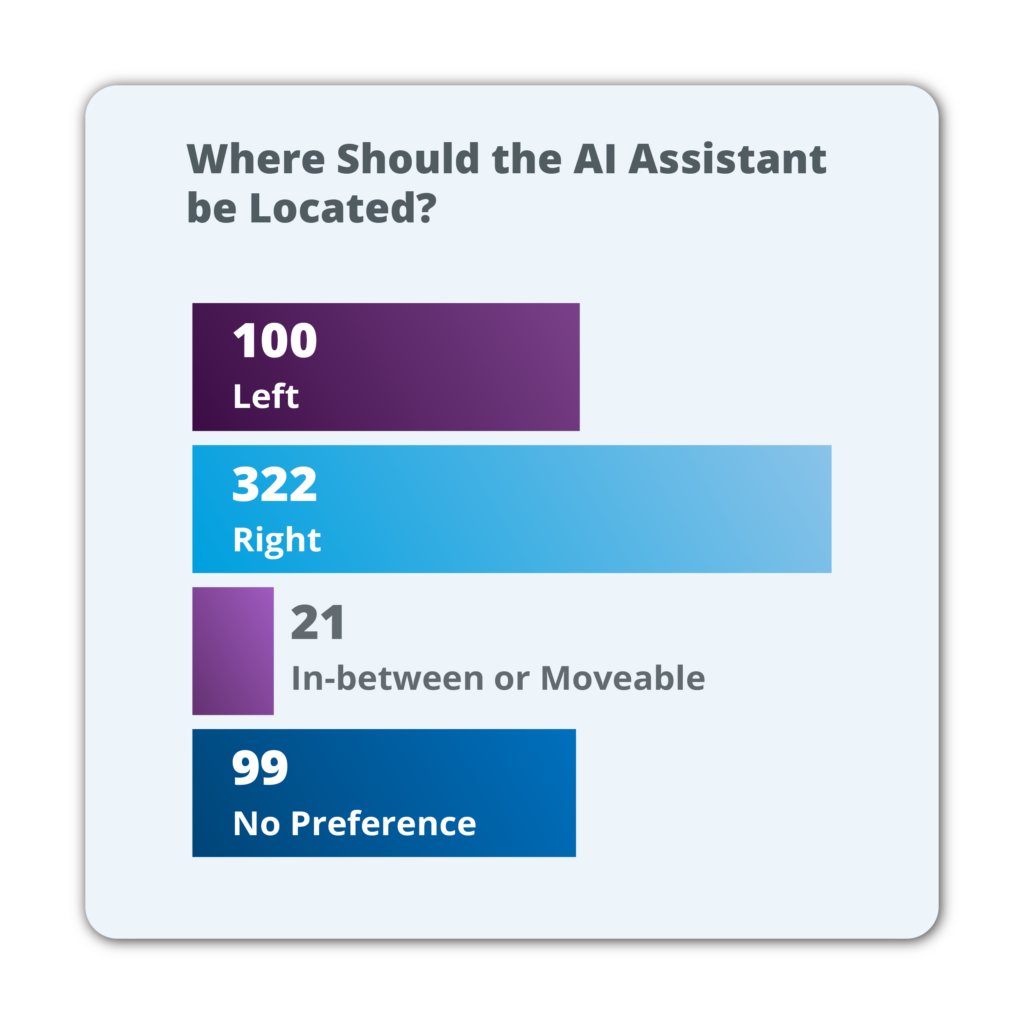
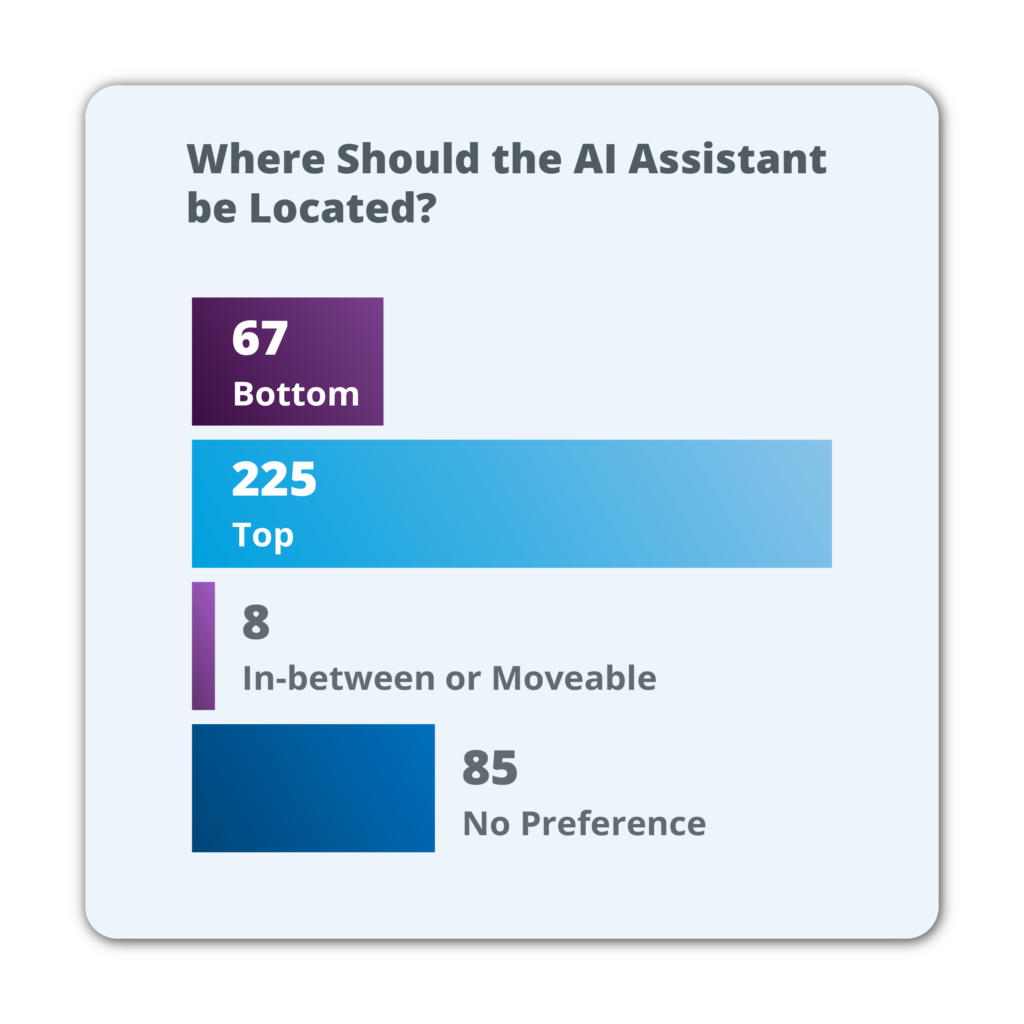
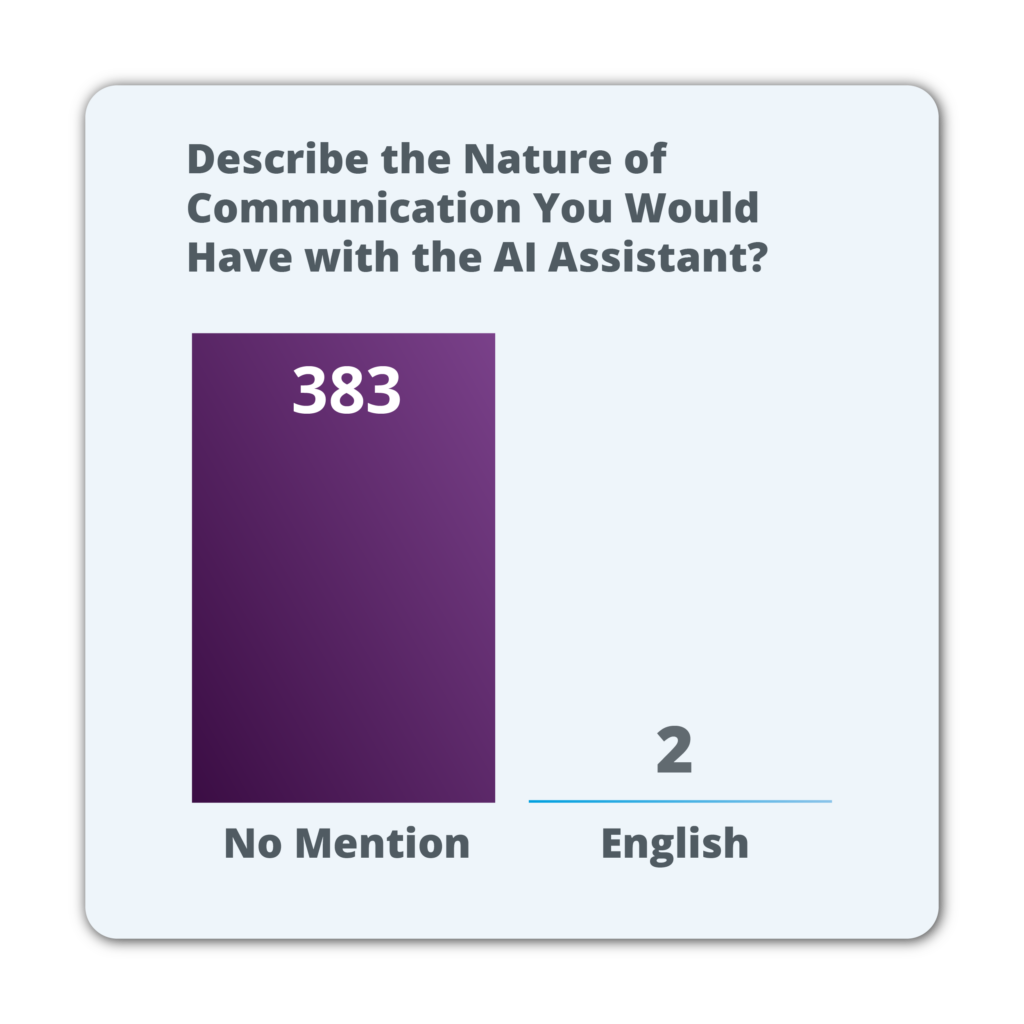
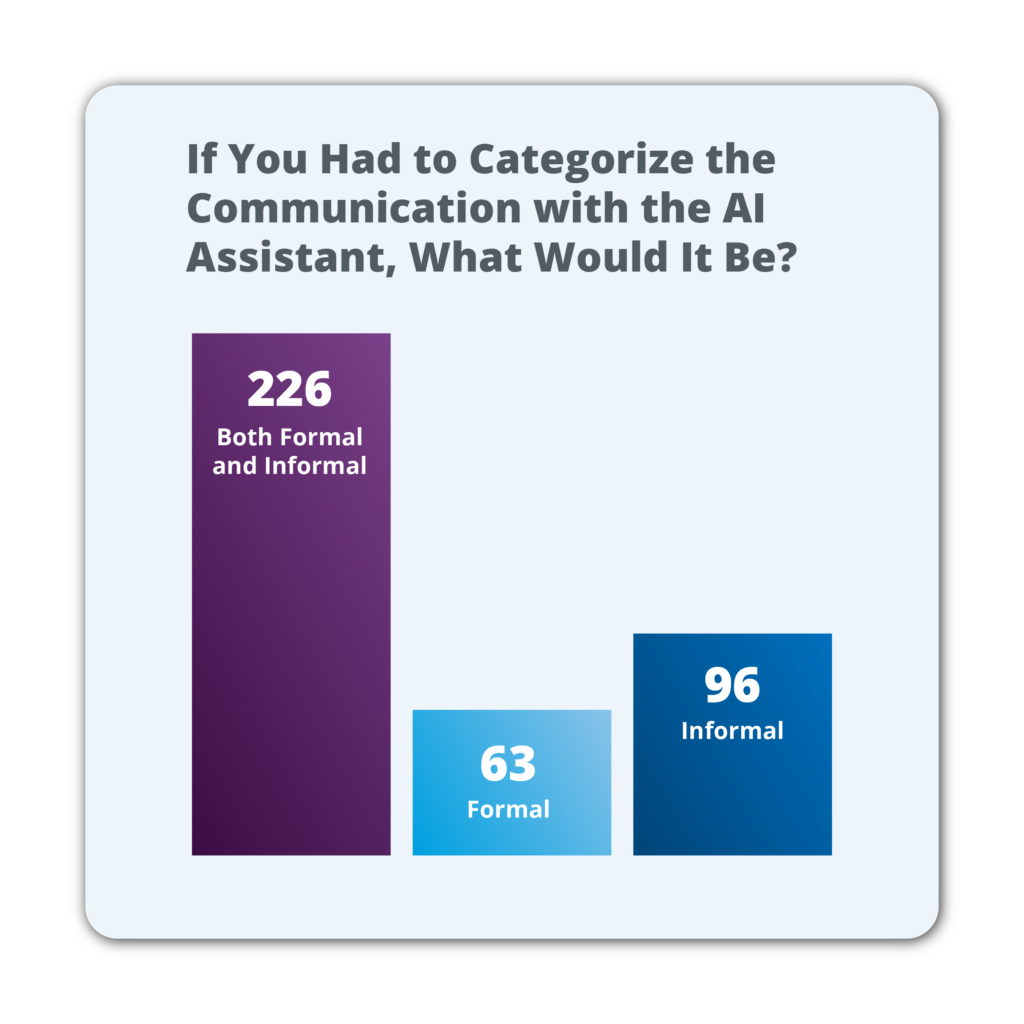
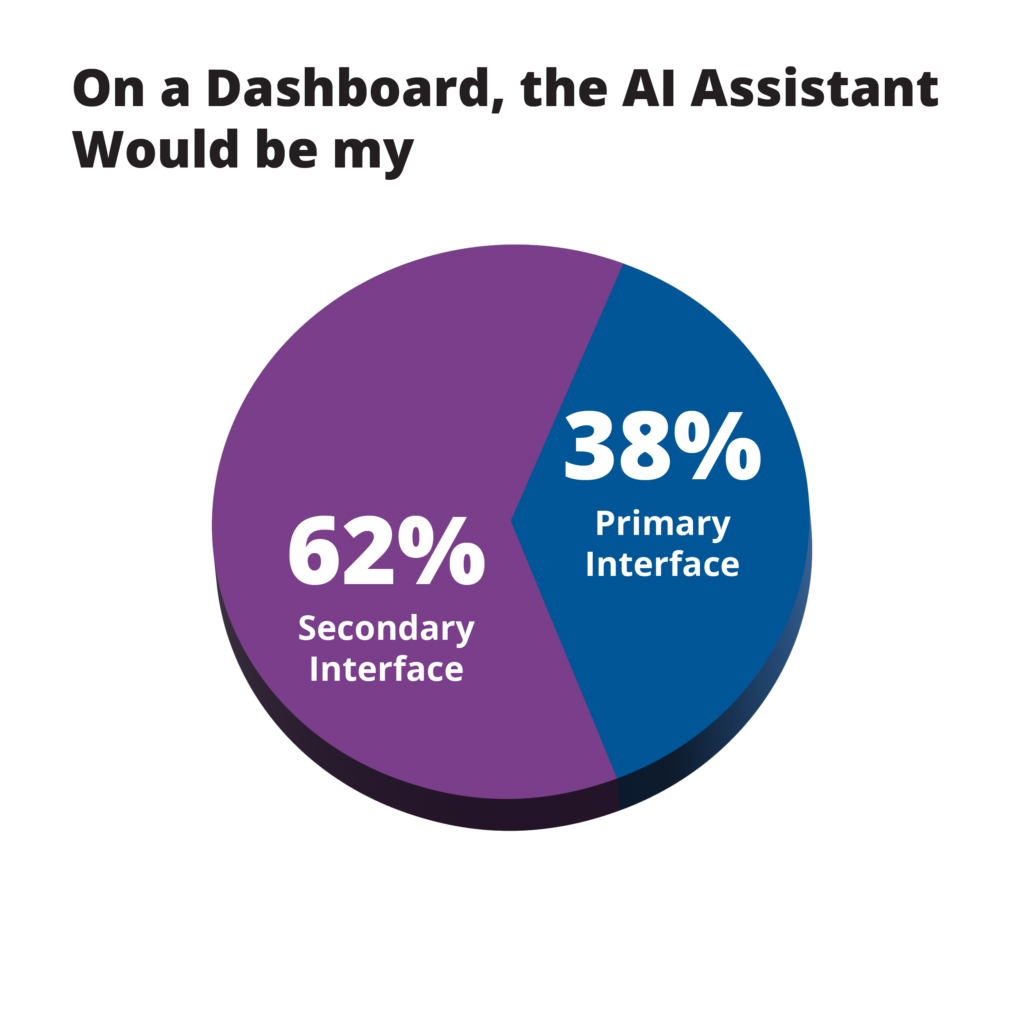
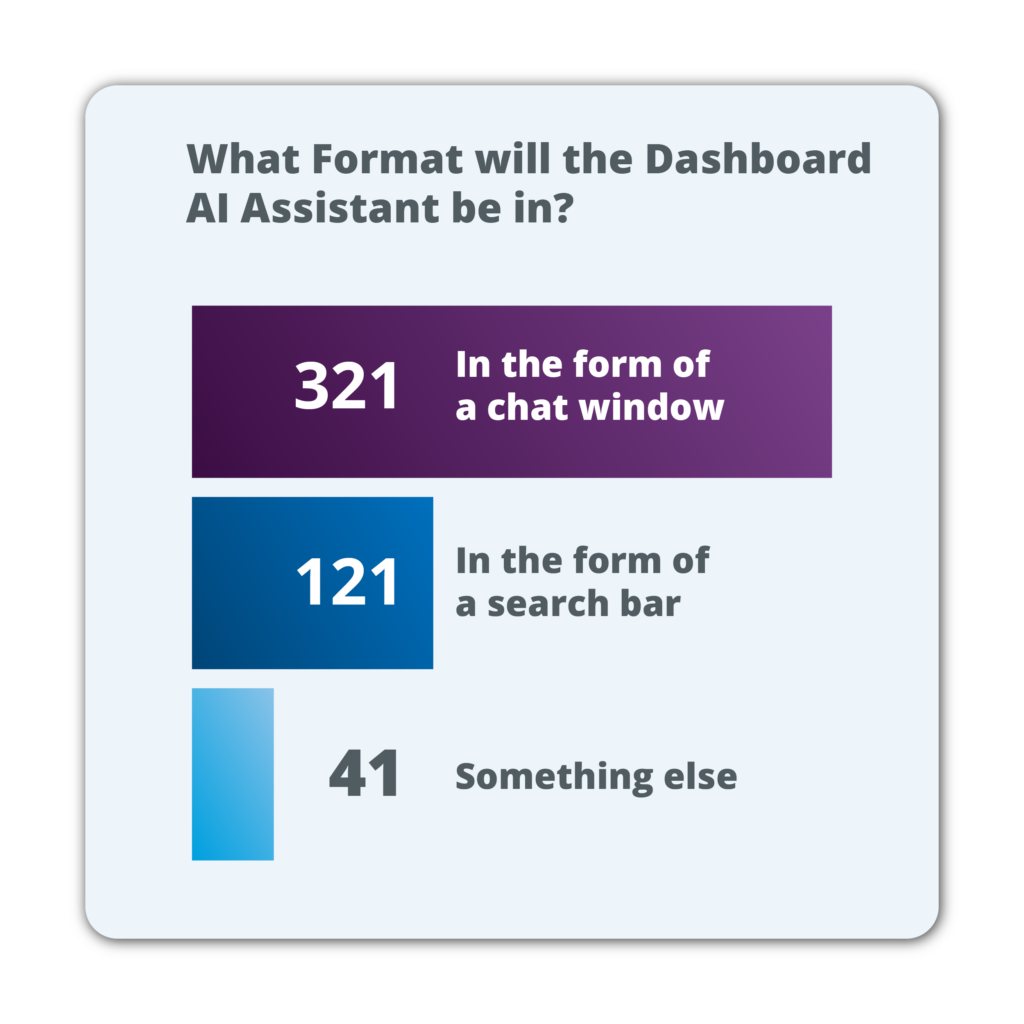
Despite the fact that most survey responders had not used an AI assistant on a dashboard before, 83.6% of them expressed having a very robust mental model of where they expected to view an AI assistant. 42.8% expected it to be on the right-hand side of the screen, and 58.4% expected it to be on the left-hand side of the screen. When asked about the primacy of interface, more than half (62%) indicated that an AI assistant would be their secondary interface. 83.8% wanted an AI assistant to be in the form of a chat window, and 31.4% wanted it to be in the form of a search bar in which they could enter a question and receive an answer. When it came to language, users expected to converse with an AI assistant in a text-based, casual, natural, narrative format. As for tone, users expressed the need for a combination of formal and informal tones, indicating an area of design requiring further analysis.
Trust in technology was a key theme for users of all types. Users communicated a need for accurate results. Moreover, users were hoping to personalize the tone, appearance, and other aspects of an AI assistant. Control in the form of naming the AI assistant and customizing the length of an answer, the location of the AI assistant, and the management of dashboard visualizations and metrics is important to consumers, and these appear to be expected features in an AI assistant. More research on what would reinforce trust, especially with the low-code user in terms of votes from other users, accuracy of results, underlying models used in producing results, and insights used to justify business and domain decisions, is needed.
Sample information
We presented the findings of this research at the Graylog GO 2023 user conference.
References
- Graylog GO 2023.
- Nielsen Norman Group, “The 6 Levels of UX Maturity”
- Sundar, A. “OpenSearch Dashboards: Community Insights”
- Sundar, A. “OpenSearch Project Q1 community survey results”