You're viewing version 2.5 of the OpenSearch documentation. This version is no longer maintained. For the latest version, see the current documentation. For information about OpenSearch version maintenance, see Release Schedule and Maintenance Policy.
Working with findings
The Findings window includes features for viewing and working with findings. The two main features are:
- The bar graph with findings information arranged by count, date, and log type or rule severity.
- The Findings list arranged by time, finding ID, rule name, and other details.
You can select the Refresh button at any time to refresh information on the Findings page.
The Findings graph
The findings graph can display findings by log type or rule severity. Use the Group by dropdown list to specify either log type or rule severity.
To specify the date range you would like the graph to display, first select the calendar dropdown list. The date selector window opens. 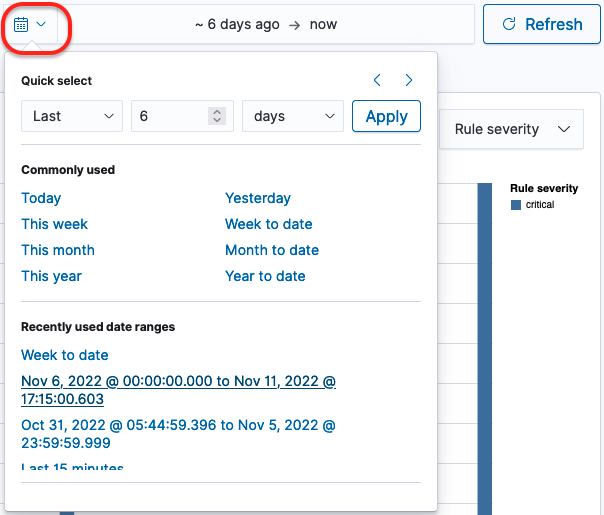
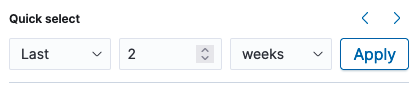
You can use the Quick select settings to specify an exact window of time.
- Select either Last or Next in the first dropdown list to set the window of time behind the current setting or ahead of the current setting.
- Select a number in the second dropdown list to define a value for the range.
- Select a unit of time in the third dropdown list. Available options are seconds, minutes, hours, days, weeks, months, and years. Select the Apply button to apply the range of dates to the graph. Information on the graph changes accordingly.
You can use the left and right arrows to move the window of time behind the current range of dates or ahead of the current range of dates. When you use these arrows, the start date and end date appear in the date range field. You can then select each one to set an absolute, relative, or current date and time. For absolute and relative changes, select the Update button to apply the changes.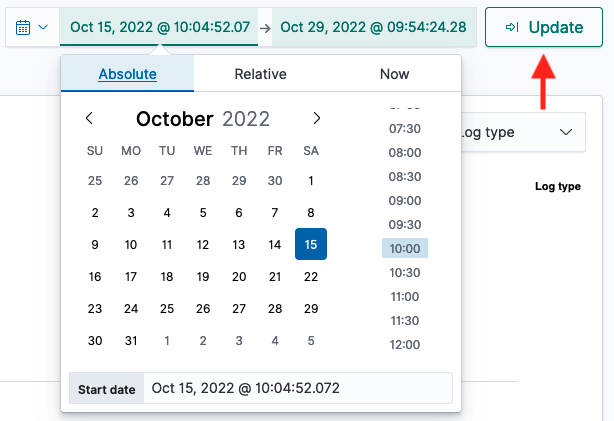
As an alternative, you can select an option in the Commonly used section (see the preceding image of the calendar dropdown list) to conveniently set a window of time. Options include date ranges such as Today, Yesterday, this week, and week to date.
When one of the commonly used windows of time is selected, you can select the Show dates label in the date range field to populate the range of dates. Following that, you can select either the start date or end date to specify by an absolute, relative, or current date and time setting. For absolute and relative changes, select the Update button to apply the changes.
As one more alternative, you can select an option from the Recently used date ranges section to go back to a previous setting.
The Findings list
The Findings list displays all findings according to time of the finding, the finding ID, the rule name that generated the finding, the detector that captured the finding, and other details. 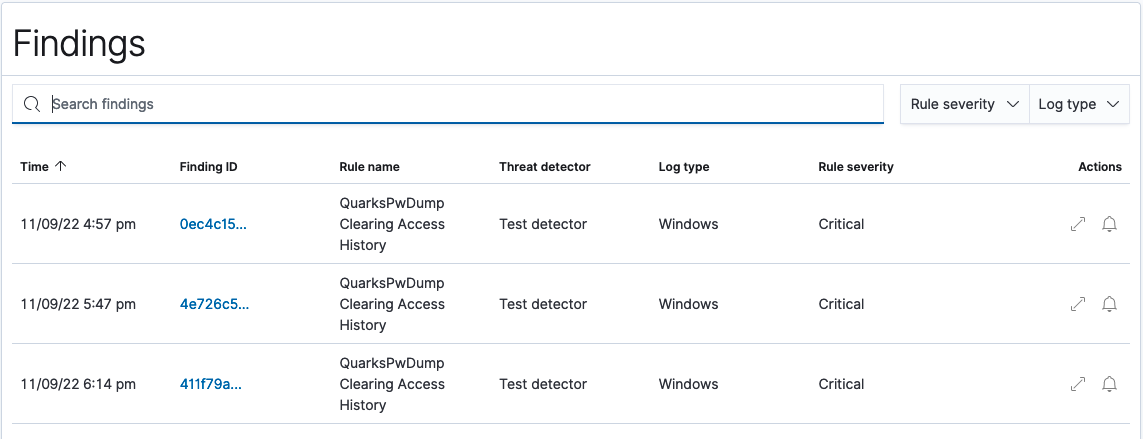 Use the Rule severity dropdown list to filter the list of findings by severity. Use the log type dropdown list to filter the list by log type. Each finding in the list includes a finding ID. You can select the ID to open the Finding details pane, which describes the finding by parameters defined when creating the detector. The Actions column includes two options for each finding:
- The diagonal arrow provides another way to open the Findings detail pane.
- The bell icon allows you to open the Create detector alert trigger pane, where you can quickly set up an alert for the specific finding and modify rules and their conditions as required. For details on setting up an alert, see Set up alerts in detector creation documentation.