You're viewing version 1.3 of the OpenSearch documentation. For the latest version, see the current documentation. For information about OpenSearch version maintenance, see Release Schedule and Maintenance Policy.
Exploring data
Discover in OpenSearch Dashboards helps you extract insights and get value out of data assets across your organization. Discover enables you to:
- Explore data. You can explore, customize, and filter data as well as search data using Dashboards Query Language (DQL).
- Analyze data. You can analyze data, view individual documents, and create tables summarizing data contents.
- Visualize data. You can display findings from your saved searches in a single dashboard that combines different data visualization types.
Try it: Exploring sample data with Discover
This tutorial shows you how to use Discover to analyze and understand a sample dataset. At the end of this tutorial, you should be ready to use Discover with your own data.
Before starting this tutorial, make sure you’ve added the Sample flight data. See Quickstart guide for OpenSearch Dashboards for information about how to get started.
Setting up data
Watch the following short video or start with the tutorial steps to learn how to set up a sample dataset in Discover.
- Verify access to OpenSearch Dashboards by connecting to http://localhost:5601 from a browser. The default username and password are
admin. - On the Home page, choose Discover in the navigation pane.
- On the index pattern toolbar, select the opensearch_dashboards_sample_data_flights dataset.
- On the time filter toolbar, choose the calendar icon and then change the time range to Last 7 days.
Exploring the data fields
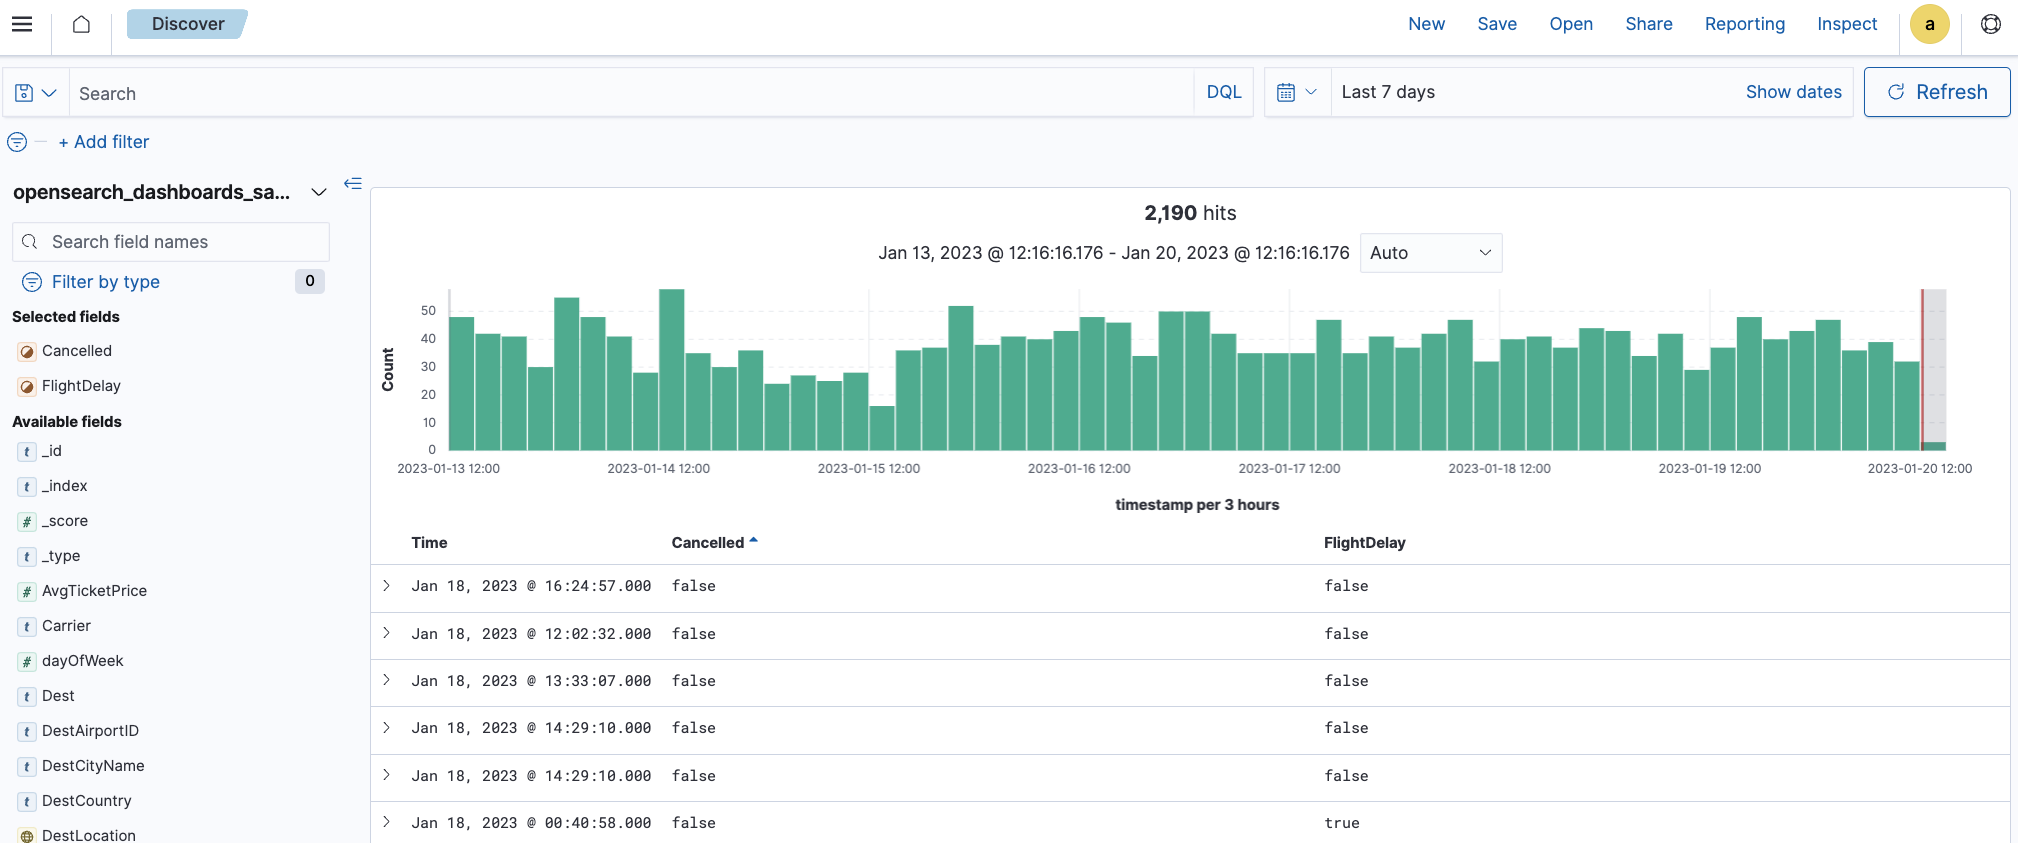
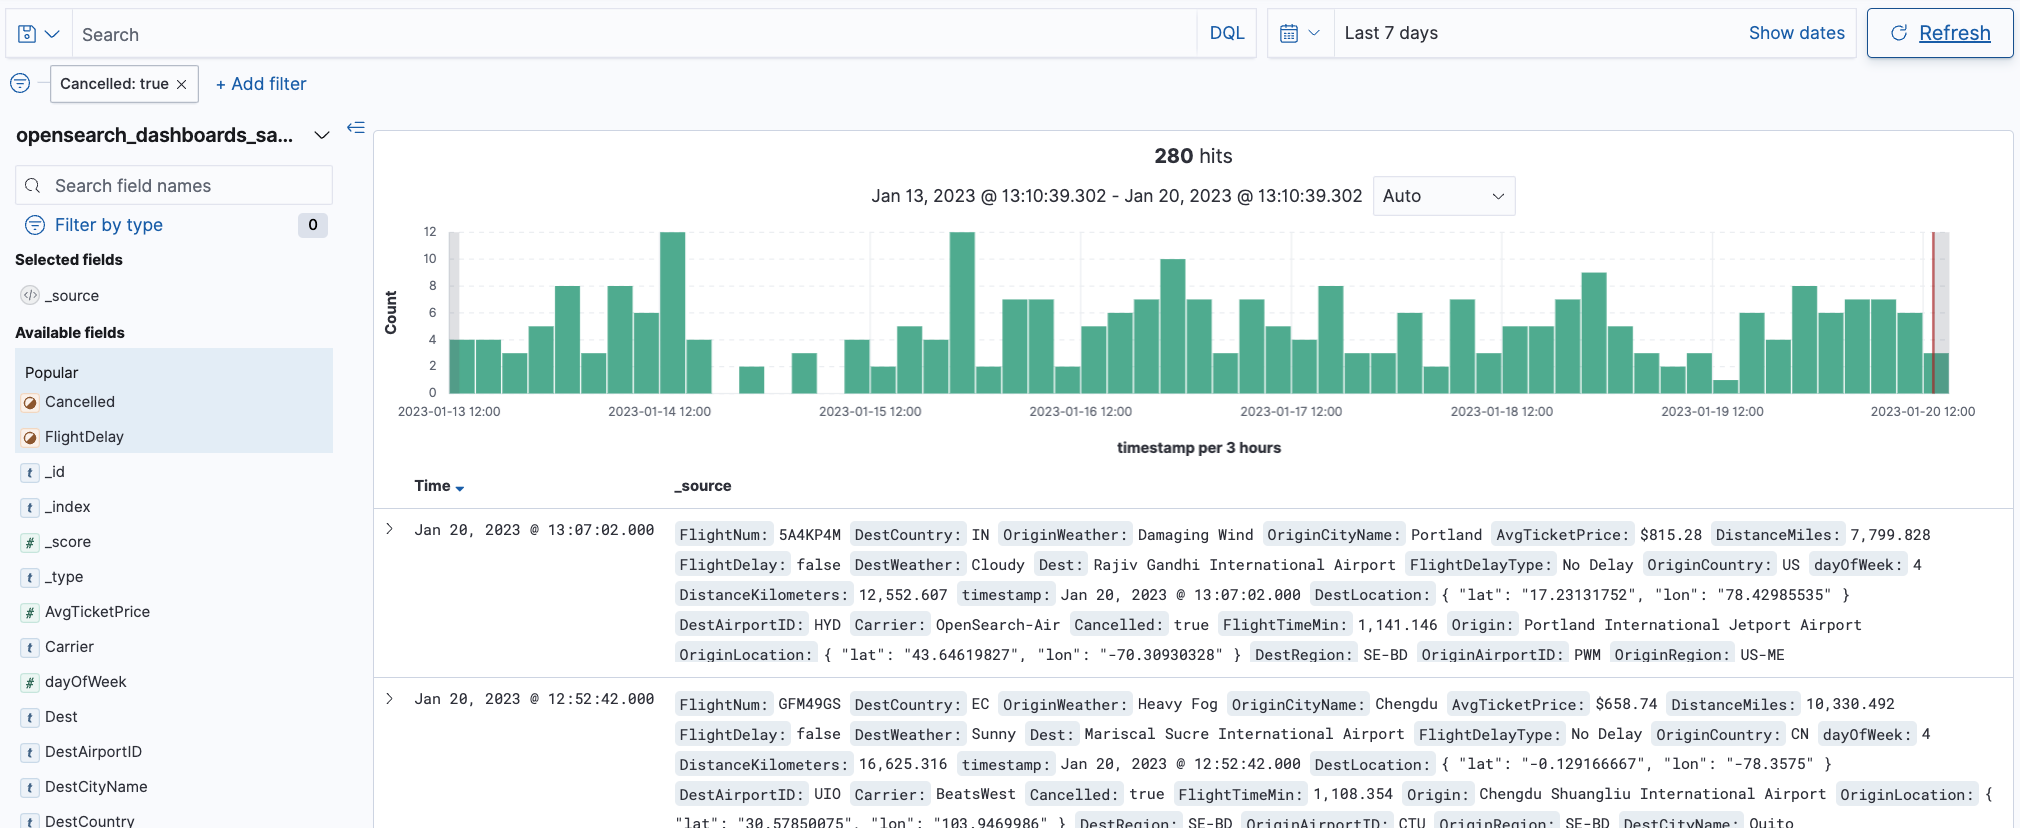
In the Discover panel, you’ll see a table that shows all the documents that match your search. The table includes a list of data fields that are available in the document table, as shown in the following image.
Follow these steps to explore the data fields:
- View the list of Available fields.
- Choose Cancelled to view the values (
trueandfalse). - Choose the plus (+) sign to add the field to the document table. The field will be automatically added to Selected fields and the document table.
- Select FlightDelay from the Available fields list, and then choose the plus (+) sign to add the field to the document table.
- Optional: Rearrange the table columns by selecting the table header and then choosing Move left or Move right.
Searching data
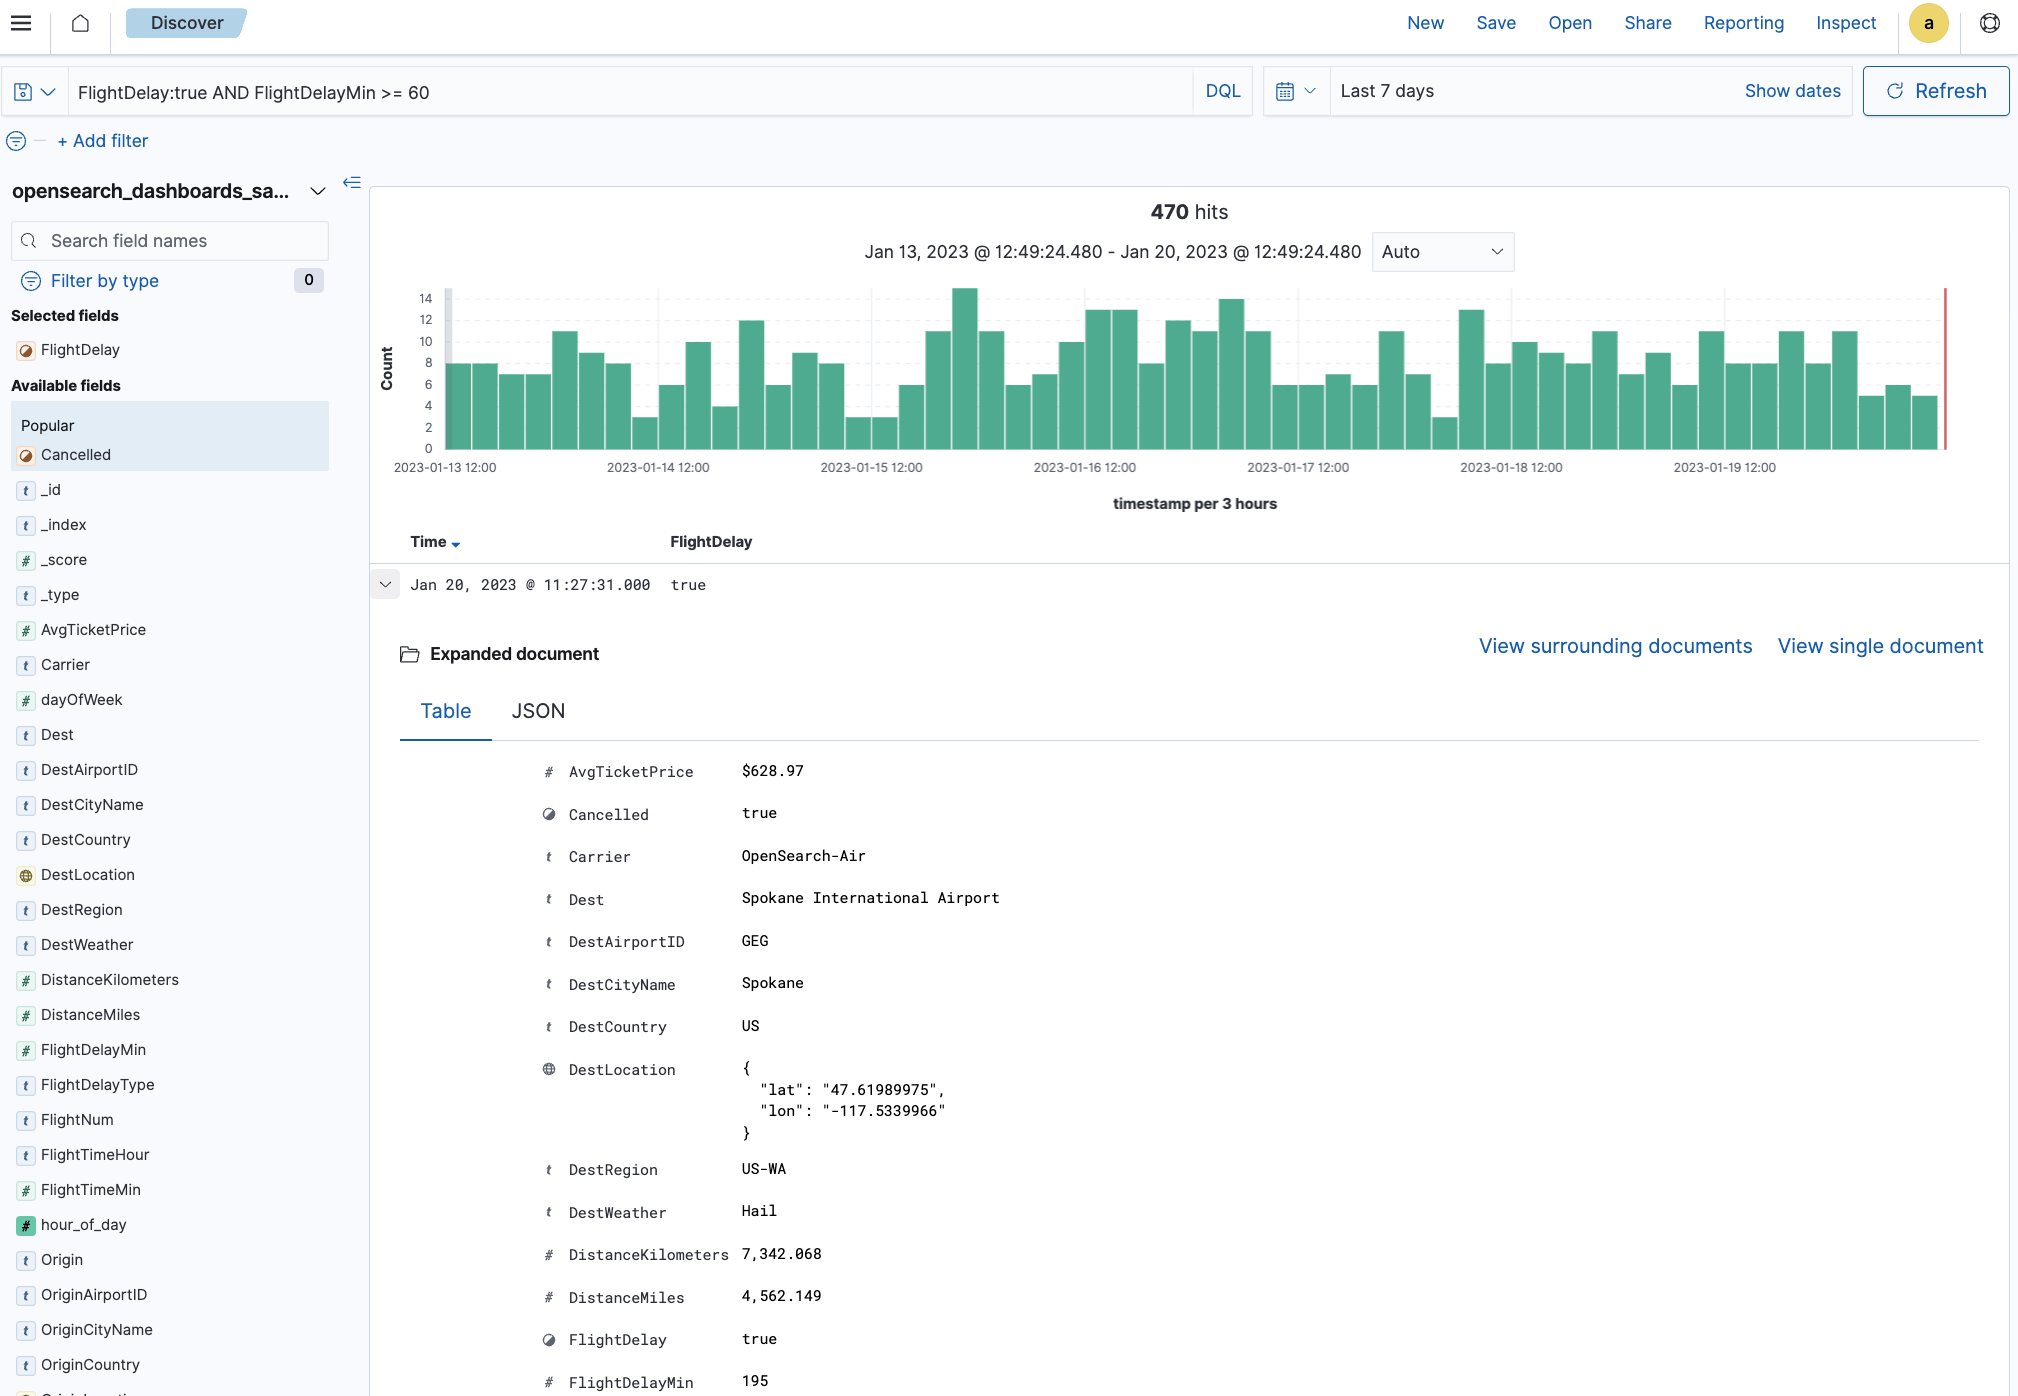
You can use the search toolbar or enter a DQL query in the DevTools console to search data in Dashboards, as shown in the following image. The search toolbar is best for basic queries, such as searching by a field name. DQL is best for complex queries, such as searching data using a term, string, Boolean, date, range, or nested query.
Follow these steps to search data:
- In the search toolbar, enter the Boolean query. For example, enter
FlightDelay:true AND FlightDelayMin >= 60to search the data for flights delayed by 60 minutes or more. - Choose Update.
- Optional: Choose the arrow (
>) in a table row to expand the row and view the document table details.
Filtering data
Filters allow you to refine sets of documents to subsets of those documents. For example, you can filter data to include or exclude certain fields, as shown in the following image.
Follow these steps to filter data:
- In the filter bar, choose Add filter.
- Select options from the Field, Operator, and Value dropdown lists. For example,
Cancelled,is, andtrue. - Choose Save.
- To remove the filter, choose the close icon (x) next to the filter name.
- Optional: Add more filters to further explore the data.
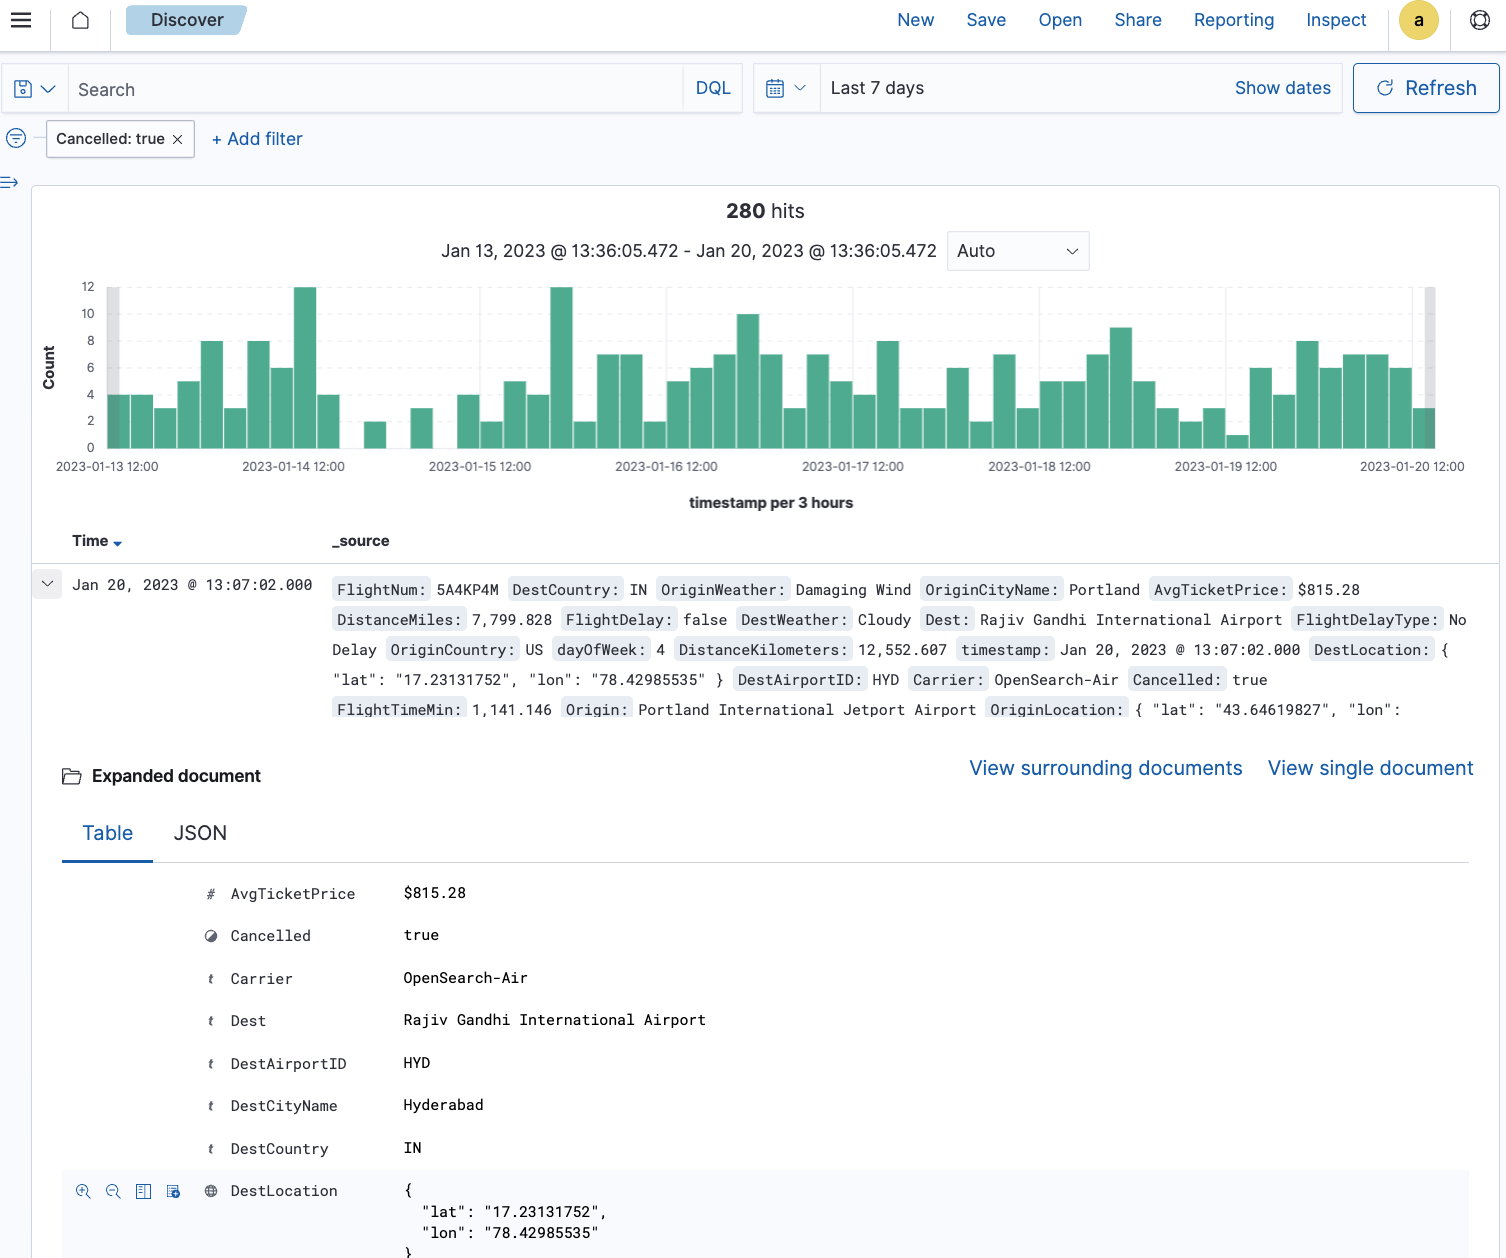
Analyzing data in the document table
You can view the document table fields to better understand the data and gather insights for more informed decision-making:
- Choose the arrow icon (>) to expand a table row.
- View the fields and details.
- Switch between the Table and JSON tabs to view the different formats, as shown in the following image.
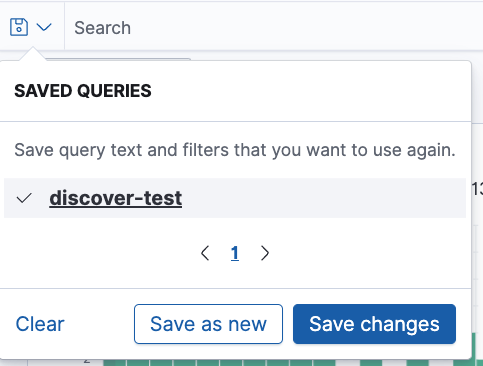
Saving the search
Saving a search saves the query text, filters, and current data view. To save your search to use it later, generate a report, or build visualizations and dashboards:
- Choose the save icon in the toolbar.
- Give the search a title, and then choose Save.
- Choose the save icon to access the saved search, as shown in the following image.
Visualizing the search
You can quickly visualize an aggregated field from Discover:
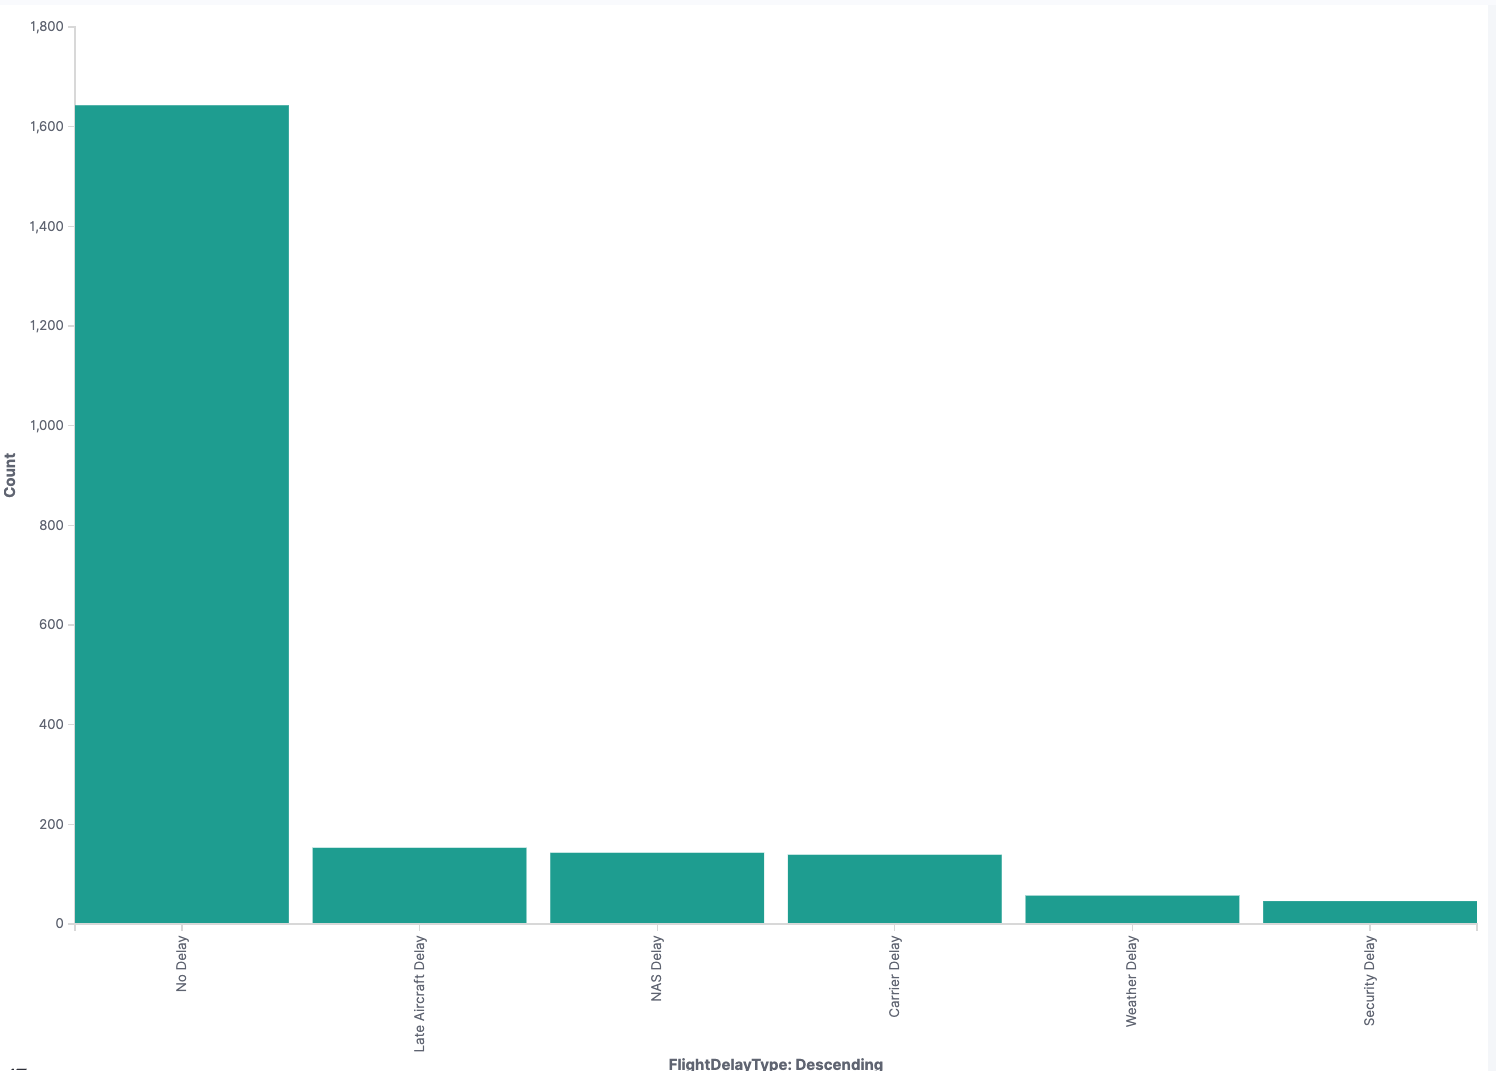
- From the Available fields list, select
FlightDelayTypeand then choose Visualize, as shown in the following image.
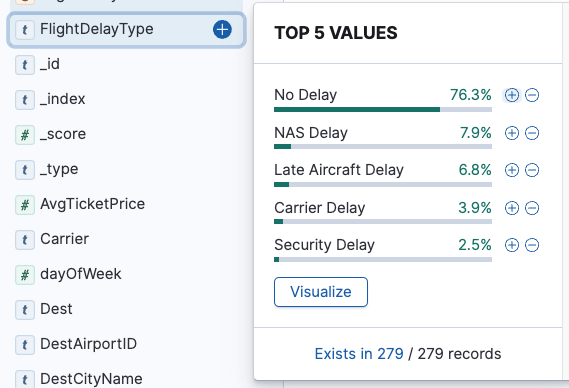
Dashboards creates a visualization for this field, which in this case is a basic bar chart, as shown in the following image.