Trace analytics
Trace analytics allows you to collect trace data and customize a pipeline that ingests and transforms the data for use in OpenSearch. The following provides an overview of the trace analytics workflow in Data Prepper, how to configure it, and how to visualize trace data.
Introduction
When using Data Prepper as a server-side component to collect trace data, you can customize a Data Prepper pipeline to ingest and transform the data for use in OpenSearch. Upon transformation, you can visualize the transformed trace data for use with the Observability plugin inside of OpenSearch Dashboards. Trace data provides visibility into your application’s performance, and helps you gain more information about individual traces.
The following flowchart illustrates the trace analytics workflow, from running OpenTelemetry Collector to using OpenSearch Dashboards for visualization.
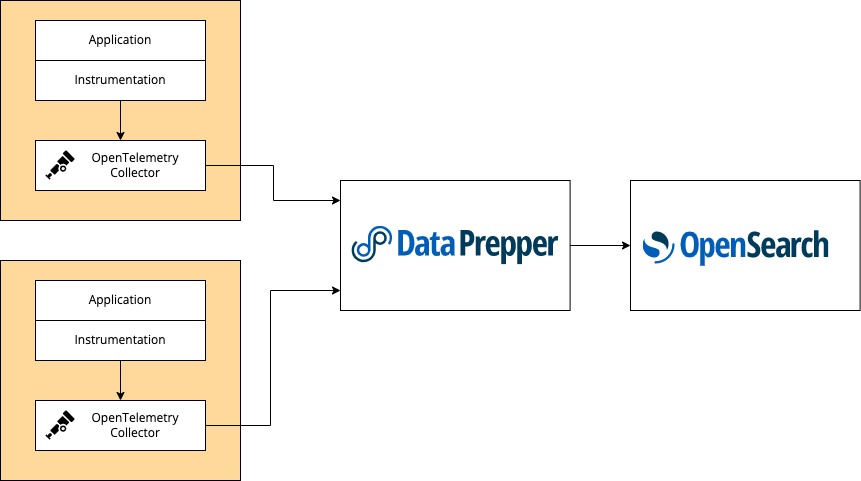
To monitor trace analytics, you need to set up the following components in your service environment:
- Add instrumentation to your application so it can generate telemetry data and send it to an OpenTelemetry collector.
- Run an OpenTelemetry collector as a sidecar or daemonset for Amazon Elastic Kubernetes Service (Amazon EKS), a sidecar for Amazon Elastic Container Service (Amazon ECS), or an agent on Amazon Elastic Compute Cloud (Amazon EC2). You should configure the collector to export trace data to Data Prepper.
- Deploy Data Prepper as the ingestion collector for OpenSearch. Configure it to send the enriched trace data to your OpenSearch cluster or to the Amazon OpenSearch Service domain.
- Use OpenSearch Dashboards to visualize and detect problems in your distributed applications.
Trace analytics pipeline
To monitor trace analytics in Data Prepper, we provide three pipelines: entry-pipeline, raw-trace-pipeline, and service-map-pipeline. The following image provides an overview of how the pipelines work together to monitor trace analytics.
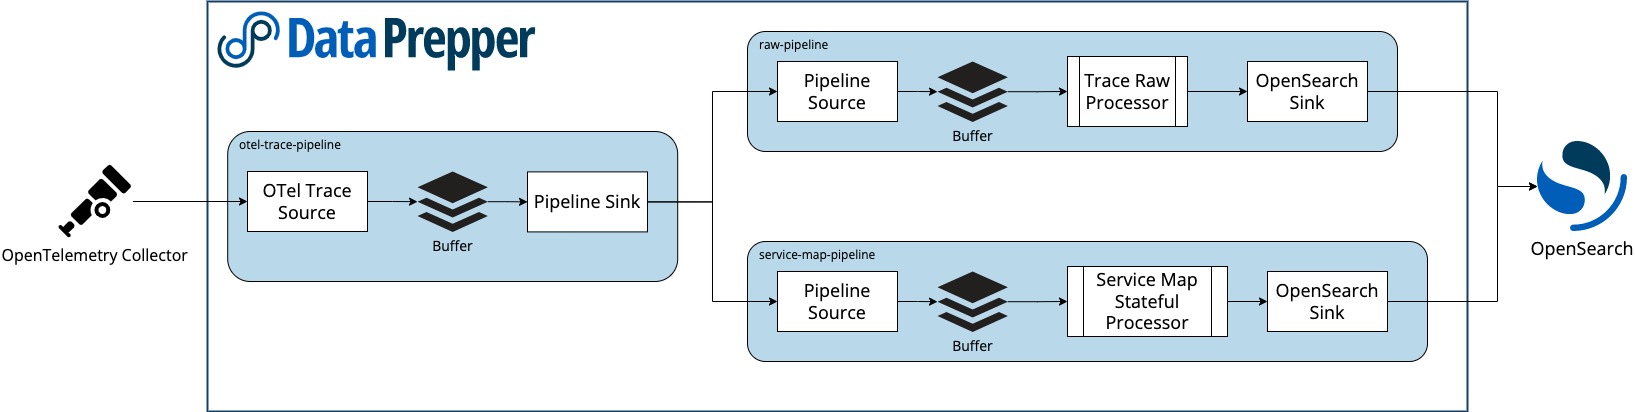
OpenTelemetry trace source
The OpenTelemetry source accepts trace data from the OpenTelemetry Collector. The source follows the OpenTelemetry Protocol and officially supports transport over gRPC and the use of industry-standard encryption (TLS/HTTPS).
Processor
There are three processors for the trace analytics feature:
- otel_traces_raw – The otel_traces_raw processor receives a collection of span records from otel-trace-source, and performs stateful processing, extraction, and completion of trace-group-related fields.
- otel_traces_group – The otel_traces_group processor fills in the missing trace-group-related fields in the collection of span records by looking up the OpenSearch backend.
- service_map_stateful – The service_map_stateful processor performs the required preprocessing for trace data and builds metadata to display the
service-mapdashboards.
OpenSearch sink
OpenSearch provides a generic sink that writes data to OpenSearch as the destination. The OpenSearch sink has configuration options related to the OpenSearch cluster, such as endpoint, SSL, username/password, index name, index template, and index state management.
The sink provides specific configurations for the trace analytics feature. These configurations allow the sink to use indexes and index templates specific to trace analytics. The following OpenSearch indexes are specific to trace analytics:
- otel-v1-apm-span –- The otel-v1-apm-span index stores the output from the otel_traces_raw processor.
- otel-v1-apm-service-map –- The otel-v1-apm-service-map index stores the output from the service_map_stateful processor.
Trace tuning
Starting with version 0.8.x, Data Prepper supports both vertical and horizontal scaling for trace analytics. You can adjust the size of a single Data Prepper instance to meet your workload’s demands and scale vertically.
You can scale horizontally by using the core peer forwarder to deploy multiple Data Prepper instances to form a cluster. This enables Data Prepper instances to communicate with instances in the cluster and is required for horizontally scaling deployments.
Scaling recommendations
Use the following recommended configurations to scale Data Prepper. We recommend that you modify parameters based on the requirements. We also recommend that you monitor the Data Prepper host metrics and OpenSearch metrics to ensure that the configuration works as expected.
Buffer
The total number of trace requests processed by Data Prepper is equal to the sum of the buffer_size values in otel-trace-pipeline and raw-pipeline. The total number of trace requests sent to OpenSearch is equal to the product of batch_size and workers in raw-trace-pipeline. For more information about raw-pipeline, see Trace analytics pipeline.
We recommend the following when making changes to buffer settings:
- The
buffer_sizevalue inotel-trace-pipelineandraw-pipelineshould be the same. - The
buffer_sizeshould be greater than or equal toworkers*batch_sizein theraw-pipeline.
Workers
The workers setting determines the number of threads that are used by Data Prepper to process requests from the buffer. We recommend that you set workers based on the CPU utilization. This value can be higher than the number of available processors because Data Prepper uses significant input/output time when sending data to OpenSearch.
Heap
Configure the Data Prepper heap by setting the JVM_OPTS environment variable. We recommend that you set the heap value to a minimum value of 4 * batch_size * otel_send_batch_size * maximum size of indvidual span.
As mentioned in the OpenTelemetry Collector section, set otel_send_batch_size to a value of 50 in your OpenTelemetry Collector configuration.
Local disk
Data Prepper uses the local disk to store metadata required for service map processing, so we recommend storing only the following key fields: traceId, spanId, parentSpanId, spanKind, spanName, and serviceName. The service-map plugin stores only two files, each of which stores window_duration seconds of data. As an example, testing with a throughput of 3000 spans/second resulted in the total disk usage of 4 MB.
Data Prepper also uses the local disk to write logs. In the most recent version of Data Prepper, you can redirect the logs to your preferred path.
AWS CloudFormation template and Kubernetes/Amazon EKS configuration files
The AWS CloudFormation template provides a user-friendly mechanism for configuring the scaling attributes described in the Trace tuning section.
The Kubernetes configuration files and Amazon EKS configuration files are available for configuring these attributes in a cluster deployment.
Benchmark tests
The benchmark tests were performed on an r5.xlarge EC2 instance with the following configuration:
buffer_size: 4096batch_size: 256workers: 8Heap: 10 GB
This setup was able to handle a throughput of 2100 spans/second at 20 percent CPU utilization.
Pipeline configuration
The following sections provide examples of different types of pipelines and how to configure each type.
Example: Trace analytics pipeline
The following example demonstrates how to build a pipeline that supports the OpenSearch Dashboards Observability plugin. This pipeline takes data from the OpenTelemetry Collector and uses two other pipelines as sinks. These two separate pipelines serve two different purposes and write to different OpenSearch indexes. The first pipeline prepares trace data for OpenSearch and enriches and ingests the span documents into a span index within OpenSearch. The second pipeline aggregates traces into a service map and writes service map documents into a service map index within OpenSearch.
Starting with Data Prepper version 2.0, Data Prepper no longer supports the otel_traces_raw_prepper processor. The otel_traces_raw processor replaces the otel_traces_raw_prepper processor and supports some of Data Prepper’s recent data model changes. Instead, you should use the otel_traces_raw processor. See the following YAML file example:
entry-pipeline:
  delay: "100"
  source:
    otel_traces_source:
      ssl: false
  buffer:
    bounded_blocking:
      buffer_size: 10240
      batch_size: 160
  sink:
    - pipeline:
        name: "raw-trace-pipeline"
    - pipeline:
        name: "service-map-pipeline"
raw-pipeline:
  source:
    pipeline:
      name: "entry-pipeline"
  buffer:
    bounded_blocking:
      buffer_size: 10240
      batch_size: 160
  processor:
    - otel_traces_raw:
  sink:
    - opensearch:
        hosts: ["https://localhost:9200"]
        insecure: true
        username: admin
        password: admin
        index_type: trace-analytics-raw
service-map-pipeline:
  delay: "100"
  source:
    pipeline:
      name: "entry-pipeline"
  buffer:
    bounded_blocking:
      buffer_size: 10240
      batch_size: 160
  processor:
    - service_map_stateful:
  sink:
    - opensearch:
        hosts: ["https://localhost:9200"]
        insecure: true
        username: admin
        password: admin
        index_type: trace-analytics-service-map
To maintain similar ingestion throughput and latency, scale the buffer_size and batch_size by the estimated maximum batch size in the client request payload. {: .tip}
Example: otel trace
The following is an example otel-trace-source .yaml file with SSL and basic authentication enabled. Note that you will need to modify your otel-collector-config.yaml file so that it uses your own credentials.
source:
  otel_traces_source:
    #record_type: event  # Add this when using Data Prepper 1.x. This option is removed in 2.0
    ssl: true
    sslKeyCertChainFile: "/full/path/to/certfile.crt"
    sslKeyFile: "/full/path/to/keyfile.key"
    authentication:
      http_basic:
        username: "my-user"
        password: "my_s3cr3t"
Example: pipeline.yaml
The following is an example pipeline.yaml file without SSL and basic authentication enabled for the otel-trace-pipeline pipeline:
otel-trace-pipeline:
  # workers is the number of threads processing data in each pipeline.
  # We recommend same value for all pipelines.
  # default value is 1, set a value based on the machine you are running Data Prepper
  workers: 8
  # delay in milliseconds is how often the worker threads should process data.
  # Recommend not to change this config as we want the entry-pipeline to process as quick as possible
  # default value is 3_000 ms
  delay: "100"
  source:
    otel_traces_source:
      #record_type: event  # Add this when using Data Prepper 1.x. This option is removed in 2.0
      ssl: false # Change this to enable encryption in transit
      authentication:
        unauthenticated:
  buffer:
    bounded_blocking:
       # buffer_size is the number of ExportTraceRequest from otel-collector the data prepper should hold in memeory.
       # We recommend to keep the same buffer_size for all pipelines.
       # Make sure you configure sufficient heap
       # default value is 512
       buffer_size: 512
       # This is the maximum number of request each worker thread will process within the delay.
       # Default is 8.
       # Make sure buffer_size >= workers * batch_size
       batch_size: 8
  sink:
    - pipeline:
        name: "raw-trace-pipeline"
    - pipeline:
        name: "entry-pipeline"
raw-pipeline:
  # Configure same as the otel-trace-pipeline
  workers: 8
  # We recommend using the default value for the raw-pipeline.
  delay: "3000"
  source:
    pipeline:
      name: "entry-pipeline"
  buffer:
      bounded_blocking:
         # Configure the same value as in entry-pipeline
         # Make sure you configure sufficient heap
         # The default value is 512
         buffer_size: 512
         # The raw processor does bulk request to your OpenSearch sink, so configure the batch_size higher.
         # If you use the recommended otel-collector setup each ExportTraceRequest could contain max 50 spans. https://github.com/opensearch-project/data-prepper/tree/v0.7.x/deployment/aws
         # With 64 as batch size each worker thread could process upto 3200 spans (64 * 50)
         batch_size: 64
  processor:
    - otel_traces_raw:
    - otel_traces_group:
        hosts: [ "https://localhost:9200" ]
        # Change to your credentials
        username: "admin"
        password: "admin"
        # Add a certificate file if you are accessing an OpenSearch cluster with a self-signed certificate
        #cert: /path/to/cert
        # If you are connecting to an Amazon OpenSearch Service domain without
        # Fine-Grained Access Control, enable these settings. Comment out the
        # username and password above.
        #aws_sigv4: true
        #aws_region: us-east-1
  sink:
    - opensearch:
        hosts: [ "https://localhost:9200" ]
        index_type: trace-analytics-raw
        # Change to your credentials
        username: "admin"
        password: "admin"
        # Add a certificate file if you are accessing an OpenSearch cluster with a self-signed certificate
        #cert: /path/to/cert
        # If you are connecting to an Amazon OpenSearch Service domain without
        # Fine-Grained Access Control, enable these settings. Comment out the
        # username and password above.
        #aws_sigv4: true
        #aws_region: us-east-1
service-map-pipeline:
  workers: 8
  delay: "100"
  source:
    pipeline:
      name: "entry-pipeline"
  processor:
    - service_map_stateful:
        # The window duration is the maximum length of time the data prepper stores the most recent trace data to evaluvate service-map relationships.
        # The default is 3 minutes, this means we can detect relationships between services from spans reported in last 3 minutes.
        # Set higher value if your applications have higher latency.
        window_duration: 180
  buffer:
      bounded_blocking:
         # buffer_size is the number of ExportTraceRequest from otel-collector the data prepper should hold in memeory.
         # We recommend to keep the same buffer_size for all pipelines.
         # Make sure you configure sufficient heap
         # default value is 512
         buffer_size: 512
         # This is the maximum number of request each worker thread will process within the delay.
         # Default is 8.
         # Make sure buffer_size >= workers * batch_size
         batch_size: 8
  sink:
    - opensearch:
        hosts: [ "https://localhost:9200" ]
        index_type: trace-analytics-service-map
        # Change to your credentials
        username: "admin"
        password: "admin"
        # Add a certificate file if you are accessing an OpenSearch cluster with a self-signed certificate
        #cert: /path/to/cert
        # If you are connecting to an Amazon OpenSearch Service domain without
        # Fine-Grained Access Control, enable these settings. Comment out the
        # username and password above.
        #aws_sigv4: true
        #aws_region: us-east-1
You need to modify the preceding configuration for your OpenSearch cluster so that the configuration matches your environment. Note that it has two opensearch sinks that need to be modified.
You must make the following changes:
hosts– Set to your hosts.username– Provide your OpenSearch username.password– Provide your OpenSearch password.aws_sigv4– If you are using Amazon OpenSearch Service with AWS signing, set this value totrue. It will sign requests with the default AWS credentials provider.aws_region– If you are using Amazon OpenSearch Service with AWS signing, set this value to your AWS Region.
For other configurations available for OpenSearch sinks, see Data Prepper OpenSearch sink.
OpenTelemetry Collector
You need to run OpenTelemetry Collector in your service environment. Follow Getting Started to install an OpenTelemetry collector. Ensure that you configure the collector with an exporter configured for your Data Prepper instance. The following example otel-collector-config.yaml file receives data from various instrumentations and exports it to Data Prepper.
Example otel-collector-config.yaml file
The following is an example otel-collector-config.yaml file:
receivers:
  jaeger:
    protocols:
      grpc:
  otlp:
    protocols:
      grpc:
  zipkin:

processors:
  batch/traces:
    timeout: 1s
    send_batch_size: 50

exporters:
  otlp/data-prepper:
    endpoint: localhost:21890
    tls:
      insecure: true

service:
  pipelines:
    traces:
      receivers: [jaeger, otlp, zipkin]
      processors: [batch/traces]
      exporters: [otlp/data-prepper]
After you run OpenTelemetry in your service environment, you must configure your application to use the OpenTelemetry Collector. The OpenTelemetry Collector typically runs alongside your application.
Next steps and more information
The OpenSearch Dashboards Observability plugin documentation provides additional information about configuring OpenSearch to view trace analytics in OpenSearch Dashboards.
For more information about how to tune and scale Data Prepper for trace analytics, see Trace tuning.
Migrating to Data Prepper 2.0
Starting with Data Prepper version 1.4, trace processing uses Data Prepper’s event model. This allows pipeline authors to configure other processors to modify spans or traces. To provide a migration path, Data Prepper version 1.4 introduced the following changes:
otel_traces_sourcehas an optionalrecord_typeparameter that can be set toevent. When configured, it will output event objects.otel_traces_rawreplacesotel_traces_raw_prepperfor event-based spans.otel_traces_groupreplacesotel_traces_group_prepperfor event-based spans.
In Data Prepper version 2.0, otel_traces_source will only output events. Data Prepper version 2.0 also removes otel_traces_raw_prepper and otel_traces_group_prepper entirely. To migrate to Data Prepper version 2.0, you can configure your trace pipeline using the event model.