Configuring and using multiple data sources in OpenSearch Dashboards
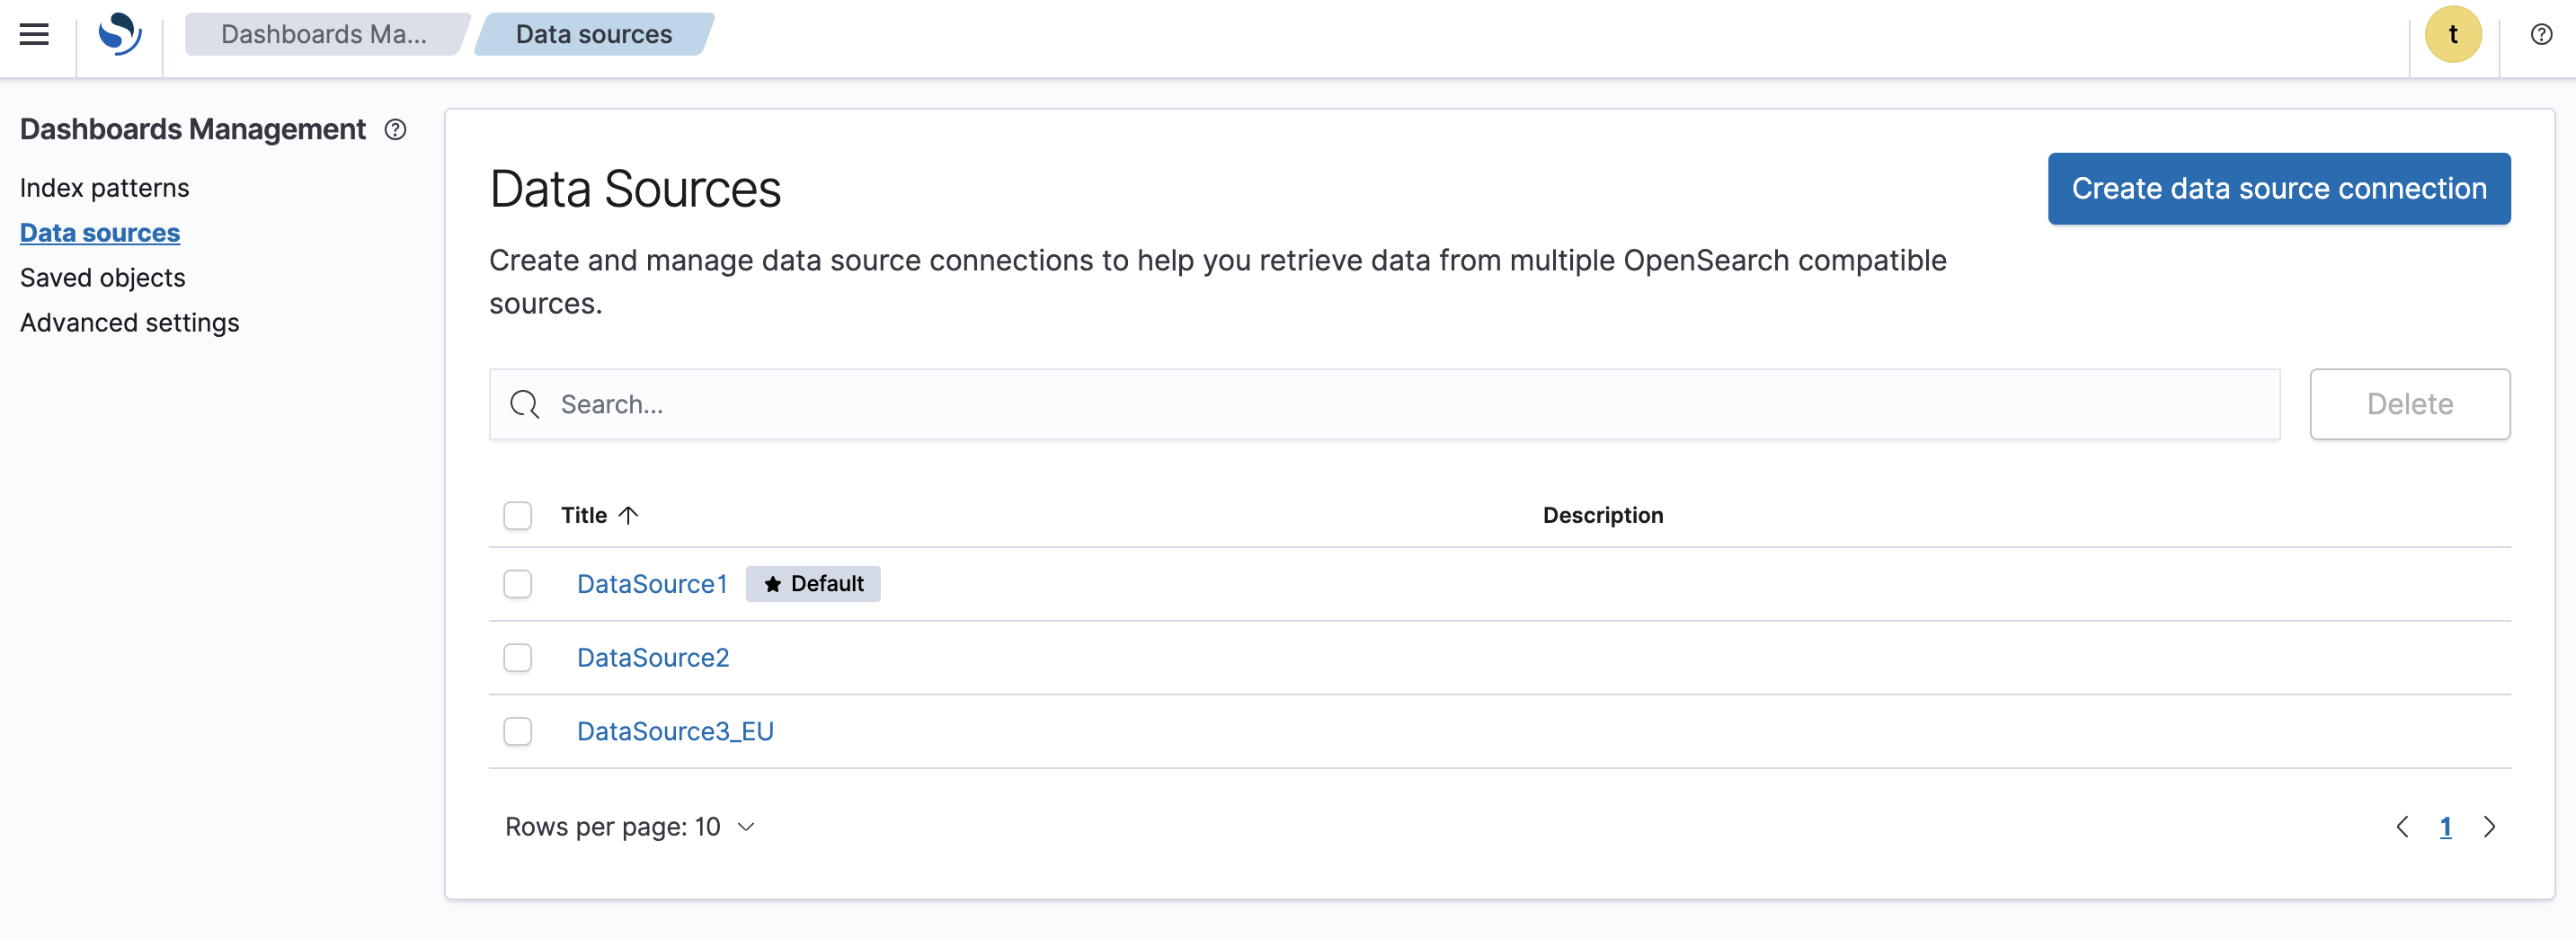
You can ingest, process, and analyze data from multiple data sources in OpenSearch Dashboards. You configure the data sources under Dashboards Management > Data sources. This interface is shown in the following image.
Getting started
The following tutorial guides you through configuring and using multiple data sources in OpenSearch Dashboards.
The following features are not supported when using multiple data sources: timeline visualization types and the gantt-chart plugin.
Step 1: Modify the YAML file settings
To use multiple data sources, you must enable the data_source.enabled setting. It is disabled by default. To enable multiple data sources:
- Open your local copy of the OpenSearch Dashboards configuration file,
opensearch_dashboards.yml. If you don’t have a copy,opensearch_dashboards.ymlis available on GitHub. - Set
data_source.enabled:totrueand save the YAML file. - Restart the OpenSearch Dashboards container.
- Verify that the configuration settings were configured properly by connecting to OpenSearch Dashboards and viewing the Dashboards Management navigation menu. Data sources appears in the sidebar. You’ll see a view similar to the following image.
Step 2: Create a new data source connection
A data source connection specifies the parameters needed to connect to a data source. These parameters form a connection string for the data source.
To create a new data source connection:
-
From the OpenSearch Dashboards main menu, select Dashboards Management > Data sources > Create data source connection.
-
Add the required information to each field to configure the Connection Details and Authentication Method.
-
Under Connection Details, enter a title and endpoint URL. For this tutorial, use the URL
https://localhost:9200/. Entering a description is optional. - Under Authentication Method, select an authentication method from the dropdown list. Once an authentication method is selected, the applicable fields for that method appear. You can then enter the required details. The authentication method options are:
- No authentication: No authentication is used to connect to the data source.
- Username & Password: A basic username and password are used to connect to the data source.
- AWS SigV4: An AWS Signature Version 4 authenticating request is used to connect to the data source. AWS Signature Version 4 requires an access key and a secret key.
- For AWS Signature Version 4 authentication, first specify the Region. Next, select the OpenSearch service from the Service Name list. The options are Amazon OpenSearch Service and Amazon OpenSearch Serverless. Last, enter the Access Key and Secret Key for authorization.
For information about available AWS Regions for AWS accounts, see Available Regions. For more information about AWS Signature Version 4 authentication requests, see Authenticating Requests (AWS Signature Version 4).
- After you have entered the appropriate details in all of the required fields, the Test connection and Create data source buttons become active. You can select Test connection to confirm that the connection is valid.
-
-
Select Create data source to save your settings. The connection is created, and the new data source appears in the list on the Data Sources main page. The first data source you create is marked as your default.
-
Edit or update a data source connection.
-
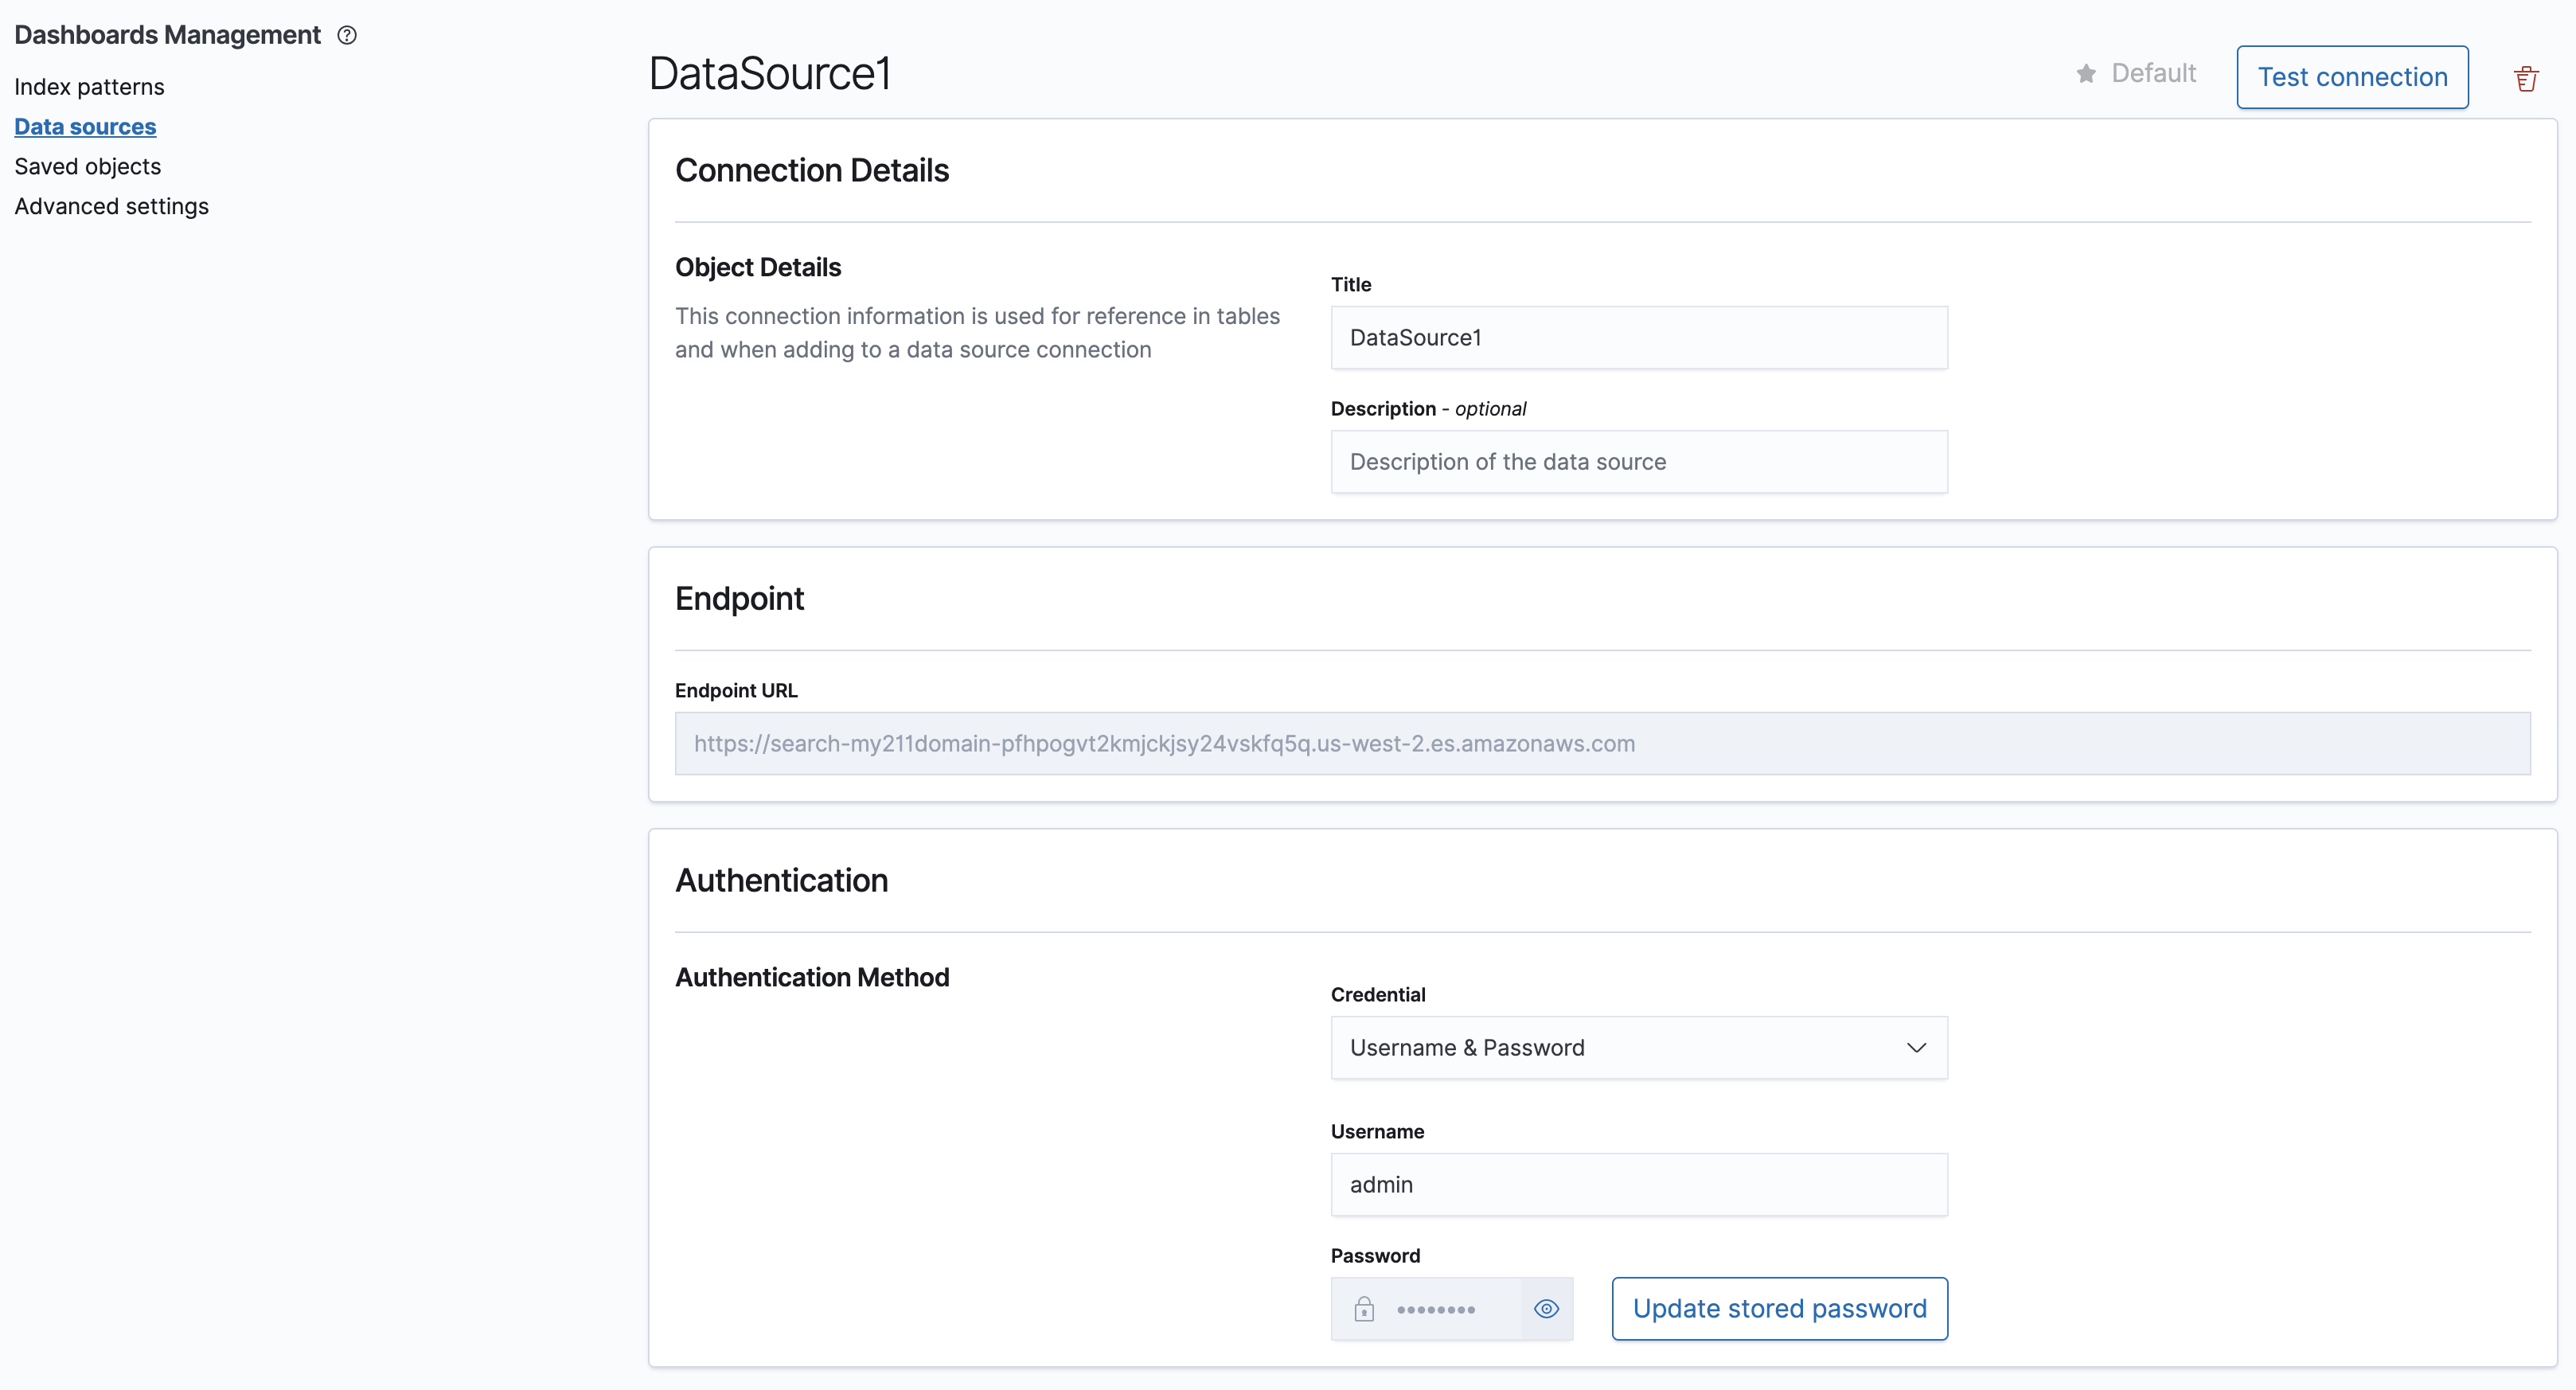
On the Data Sources main page, select the connection you want to modify. The Connection Details window opens.
-
To mark the selected data source as the default, select the Set as default option.
-
To make changes to Connection Details, edit one or both of the Title and Description fields and select Save changes in the lower-right corner of the screen. You can also cancel changes here. To change the Authentication Method, choose a different authentication method, enter your credentials (if applicable), and then select Save changes in the lower-right corner of the screen. The changes are saved.
- When Username & Password is the selected authentication method, you can update the password by choosing Update stored password next to the Password field. In the pop-up window, enter a new password in the first field and then enter it again in the second field to confirm. Select Update stored password in the pop-up window. The new password is saved. Select Test connection to confirm that the connection is valid.
- When AWS SigV4 is the selected authentication method, you can update the credentials by selecting Update stored AWS credential. In the pop-up window, enter a new access key in the first field and a new secret key in the second field. Select Update stored AWS credential in the pop-up window. The new credentials are saved. Select Test connection in the upper-right corner of the screen to confirm that the connection is valid.
-
-
Delete the data source connection by selecting the check box to the left of the title and then choosing Delete 1 connection. Selecting multiple check boxes for multiple connections is supported. Alternatively, select the
 icon.
icon.
A data source connection interface is shown in the following image.
Selecting multiple data sources through the Dev Tools console
Alternatively, you can select multiple data sources through the Dev Tools console. This option allows you to work with a broader range of data and gaining a deeper understanding of your code and applications.
Watch the following 10-second video to see it in action.
To select a data source through the Dev Tools console, follow these steps:
- Locate your copy of
opensearch_dashboards.ymland open it in the editor of your choice. - Set
data_source.enabledtotrue. - Connect to OpenSearch Dashboards and select Dev Tools in the menu.
-
Enter the following query in the editor pane of the Console and then select the play button:
GET /_cat/indices - From the Data source dropdown menu, select a data source and then query the source.
- Repeat the preceding steps for each data source you want to select.
Uploading saved objects to a dashboard from connected data sources
To upload saved objects from connected data sources to a dashboard with multiple data sources, export them as an NDJSON file from the data source’s Saved object management page. Then upload the file to the dashboard’s Saved object management page. This method can simplify the transfer of saved objects between dashboards. The following 20-second video shows this feature in action.
Importing saved objects from a connected data source
Follow these steps to import saved objects from a connected data source:
- Locate your
opensearch_dashboards.ymlfile and open it in your preferred text editor. - Set
data_source.enabledtotrue. - Connect to OpenSearch Dashboards and go to Dashboards Management > Saved objects.
- Select Import > Select file and upload the file acquired from the connected data source.
- Choose the appropriate Data source from the dropdown menu, set your Conflict management option, and then select the Import button.
Showing or hiding authentication methods
Introduced 2.13
A feature flag in your opensearch_dashboards.yml file allows you to show or hide authentication methods within the data_source plugin. The following setting hides the authentication method for AWSSigV4.
# Set enabled to false to hide the authentication method from multiple data source in OpenSearch Dashboards.
# If this setting is commented out, then all three options will be available in OpenSearch Dashboards.
# The default value will be considered as true.
data_source.authTypes:
   NoAuthentication:
     enabled: true
   UsernamePassword:
     enabled: true
   AWSSigV4:
     enabled: false
The following demo shows this process.
Showing or hiding the local cluster
Introduced 2.13
A feature flag in your opensearch_dashboards.yml file allows you to hide the local cluster option within the data_source plugin. This option hides the local cluster from the data source dropdown menu and index creation page, which is ideal for environments with or without a local OpenSearch cluster. The following example setting, shown in a 20-second demo, hides the local cluster:
# hide local cluster in the data source dropdown and index pattern creation page.
data_source.hideLocalCluster: true
The following demo shows this process.
Using multiple data sources with external dashboards plugins
Introduced 2.14
The following plugins now support multiple data sources.
Index management
When you set data_source.enabled:true, you can view and select data sources and their associated indexes directly from the interface:
- Navigate to Management > Index Management under the main menu.
- Select Indexes from the sidebar menu and then select the
 icon on the upper-right menu bar.
 - Choose the appropriate data source from the dropdown menu and then choose the appropriate index from the list. By default, the indexes from your default data source are displayed. You can choose any connected data source to view its corresponding indexes.
The following GIF illustrates these steps.
To perform operations on a specific index within a data source, select the individual index from the list. To create a new index, select the Create Index button, which opens a form. Enter the required information and select the Create button. The index is created within the selected data source. The following GIF illustrates these steps.

Anomaly detection
When you set data_source.enabled:true, you can create or view detectors associated with a data source:
- Navigate to OpenSearch Plugins > Anomaly Detection under the main menu.
- Select the database icon on the upper-right menu bar to view a list of connected data sources.
- Select a data source to view a list of associated detectors. If the selected data source does not have detectors, then the Create detector button appears under the upper-right menu bar. See Creating anomaly detectors for instructions on creating detectors through the interface.
The following GIF illustrates these steps.
You can edit the data source’s associated detectors on the Detectors tab under the left side bar.
- Select Detectors and then select the icon on the upper-right menu bar.
- From the dropdown menu, select the appropriate data source. A list of associated detectors appears.
- Choose a detector from the list, select Actions, and then choose the appropriate edit option from the dropdown menu.
- Enter the applicable settings and configuration details.
The following GIF illustrates these steps.
Security
When you set data_source.enabled:true, you can view and manage roles for each connected data source:
- Navigate to Management > Security under the main menu.
- Select Roles from the left sidebar menu and then select the icon on the upper-right menu bar.
- From the dropdown menu, select the appropriate data source and then select the Create role button to add a new role.
- Enter the required configuration information and select the Create button to save.
The following GIF illustrates these steps.
Maps
When you set data_source.enabled:true, you can view all available data sources, including the ones currently used as layers, in a map:
- Navigate to OpenSearch Plugins > Maps under the main menu.
- From the dropdown menu, select the appropriate data source to edit or create an associated map layer:
- Edit a map layer by selecting one from the Layers dropdown menu. In the pop-up window, view the settings and edit them as needed.
- Add a new layer by selecting the Add layer button from the dropdown menu and then selecting Documents in the pop-up window. Another pop-up window appears on the right. Enter the required information on the Data tab. Note that the data source name is prefixed to the index pattern name. The Style and Settings tabs include optional information.
- Select Update to save the settings.
- Select the Save button on the menu bar to save the edited or new layer.
- Select the icon on the upper-right menu bar to verify that the new data source is listed in the dropdown menu.
The following GIF illustrates these steps.
Machine learning
When you set data_source.enabled:true, you can view and manage machine learning models from different connected data sources:
- Navigate to OpenSearch Plugins > Machine Learning under the main menu.
- Select the icon and choose a data source from the dropdown menu. A list of models associated with the selected data source is displayed.
- Select the
 icon to the right of a listed model to view the model’s configuration details for the selected data source.
The following GIF illustrates these steps.
Notifications
When you set data_source.enabled:true, you can view and manage notification channels for different data sources:
- Navigate to Management > Notifications under the main menu.
- Select the icon and choose a data source from the dropdown menu. A list of channels associated with the selected data source is displayed.
- Choose a channel from the list to view or manage its settings.
- Edit the channel’s settings by selecting the Actions button and choosing the Edit option. Enter the required information in the Edit channel panel and then choose Save.
- Send a test message to the channel by selecting the Send test message button in the Edit channel window. Alternatively, you can select the Actions button in the channel details window and then choose the Send test message option from the dropdown menu.
The following GIF illustrates these steps.
Search relevance
When you set data_source.enabled:true, you can compare search results across indexes from different data sources:
- Navigate to OpenSearch Plugins > Search Relevance under the main menu.
- Select the icon and choose a data source from the dropdown menu. A list of available data sources is displayed.
- Under both Query 1 and Query 2, select a data source and an index.
- Select the Search button to run the queries. The query results are displayed in their respective results panels.
The following GIF illustrates these steps.
Security analytics
Introduced 2.15
When you set data_source.enabled:true, you can view and manage security analytics resources, such as detection rules, across multiple connected data sources:
- Navigate to OpenSearch Plugins > Security analytics under the main menu.
- Select the icon and choose a data source from the dropdown menu.
- Select Dectectors > Detection rules from the navigation menu on the left. A list of detection rules is displayed.
- Select a rule to open a pop-up window containing more information about that rule.
The following GIF illustrates these steps.
- Navigate to OpenSearch Plugins > Security analytics under the main menu.
- Select the icon and choose a data source from the dropdown menu.
- Select Dectectors > Detection rules from the navigation menu on the left.
- Select the Create detection rule button on the upper right and then enter the required configuration details in the Create detection rule window.
- Select the Create detection rule button on the lower right to save the rule. The rule is now associated with the data source.
The following GIF illustrates these steps.
Alerting
Introduced 2.15
When you set data_source.enabled:true, you can you can view and manage alerting monitors across multiple connected data sources:
- Navigate to OpenSearch Plugins > Alerting under the main menu.
- Select the icon and choose a data source from the dropdown menu. A list of associated monitors is displayed.
- Select a monitor to view its details.
The following GIF illustrates these steps.
To create a new monitor, select Create monitor. Fill out the form and select Create. The monitor is created within the selected data source.
Managing alerting monitors from within the Dashboards application
To manage data source monitors from within Dashboards:
- Navigate to the Dashboards application under the main menu and then select a dashboard from the list.
- From the dashboard, select the
 icon to open the Options dropdown menu and then choose Alerting.
 - From the Alerting dropdown menu, choose Associated monitors to open the configuration window.
- Select a monitor from the list to view or edit its details.
The following GIF illustrates these steps.
To associate a monitor with a data source:
- Navigate to the Dashboards application under the main menu and then select a dashboard from the list.
- From the dashboard, select the icon to open the Options dropdown menu and then choose Alerting.
- From the Alerting dropdown menu, choose Add alerting monitor to open the configuration window.
- Enter the configuration information and then select the Create monitor button. The monitor is now associated with the data source.
The following GIF illustrates these steps.
Next steps
After configuring multiple data sources, you can analyze the data from each source. See the following resources for more information:
- Index patterns
- Index Management
- Connecting OpenSearch and Amazon S3 through OpenSearch Dashboards
- OpenSearch Integrations