Text to visualization
This is an experimental feature and is not recommended for use in a production environment. For updates on the progress of the feature or if you want to leave feedback, join the discussion on the OpenSearch forum.
The OpenSearch Dashboards Assistant can create visualizations using natural language instructions.
Configuration
To configure text to visualization, use the following steps.
Step 1: Enable text to visualization
To enable text to visualization, configure the following opensearch_dashboards.yml setting:
assistant.text2viz.enabled: true
Step 2: Create the agents
To orchestrate text to visualization, you’ll need to create the necessary agents. Create a workflow template for creating all necessary text-to-visualization agents by sending the following request:
Request
POST /_plugins/_flow_framework/workflow
{
  "name": "Text to visualization agents",
  "description": "This template is to create all Agents required for text to visualization",
  "use_case": "REGISTER_AGENTS",
  "version": {
    "template": "1.0.0",
    "compatibility": [
      "2.18.0",
      "3.0.0"
    ]
  },
  "workflows": {
    "provision": {
      "user_params": {},
      "nodes": [
        {
          "id": "create_claude_connector",
          "type": "create_connector",
          "previous_node_inputs": {},
          "user_inputs": {
            "credential": {
              "access_key": "<YOUR_ACCESS_KEY>",
              "secret_key": "<YOUR_SECRET_KEY>",
              "session_token": "<YOUR_SESSION_TOKEN>"
            },
            "parameters": {
              "endpoint": "bedrock-runtime.us-east-1.amazonaws.com",
              "content_type": "application/json",
              "auth": "Sig_V4",
              "max_tokens_to_sample": "8000",
              "service_name": "bedrock",
              "temperature": "0.0000",
              "response_filter": "$.content[0].text",
              "region": "us-east-1",
              "anthropic_version": "bedrock-2023-05-31"
            },
            "version": "1",
            "name": "Claude haiku runtime Connector",
            "protocol": "aws_sigv4",
            "description": "The connector to BedRock service for claude model",
            "actions": [
              {
                "action_type": "predict",
                "method": "POST",
                "url": "https://bedrock-runtime.us-east-1.amazonaws.com/model/anthropic.claude-3-haiku-20240307-v1:0/invoke",
                "headers": {
                  "content-type": "application/json",
                  "x-amz-content-sha256": "required"
                },
                "request_body": "{\"messages\":[{\"role\":\"user\",\"content\":[{\"type\":\"text\",\"text\":\"${parameters.prompt}\"}]}],\"anthropic_version\":\"${parameters.anthropic_version}\",\"max_tokens\":${parameters.max_tokens_to_sample}}"
              }
            ]
          }
        },
        {
          "id": "register_claude_model",
          "type": "register_remote_model",
          "previous_node_inputs": {
            "create_claude_connector": "connector_id"
          },
          "user_inputs": {
            "name": "claude-haiku",
            "description": "Claude model",
            "deploy": true
          }
        },
        {
          "id": "create_t2vega_tool",
          "type": "create_tool",
          "previous_node_inputs": {
            "register_claude_model": "model_id"
          },
          "user_inputs": {
            "parameters": {
              "prompt": "You're an expert at creating vega-lite visualization. No matter what the user asks, you should reply with a valid vega-lite specification in json.\nYour task is to generate Vega-Lite specification in json based on the given sample data, the schema of the data, the PPL query to get the data and the user's input.\nLet's start from dimension and metric/date. Now I have a question, I already transfer it to PPL and query my Opensearch cluster. \nThen I get data. For the PPL, it will do aggregation like \"stats AVG(field_1) as avg, COUNT(field_2) by field_3, field_4, field_5\". \nIn this aggregation, the metric is [avg, COUNT(field_2)] , and then we judge the type of field_3,4,5. If only field_5 is type related to date, the dimension is [field_3, field_4], and date is [field_5]\nFor example, stats SUM(bytes) by span(timestamp, 1w), machine.os, response, then SUM(bytes) is metric and span(timestamp, 1w) is date, while machine.os, response are dimensions.\nNotice: Some fields like 'span()....' will be the date, but not metric and dimension. \nAnd one field will only count once in dimension count. You should always pick field name from schema\nTo summarize,\nA dimension is a categorical variable that is used to group, segment, or categorize data. It is typically a qualitative attribute that provides context for metrics and is used to slice and dice data to see how different categories perform in relation to each other.\nThe dimension is not date related fields. The dimension and date are very closed. The only difference is date is related to datetime, while dimension is not.\nA metric is a quantitative measure used to quantify or calculate some aspect of the data. Metrics are numerical and typically represent aggregated values like sums, averages, counts, or other statistical calculations.\n\nIf a ppl doesn't have aggregation using 'stats', then each field in output is dimension.\nOtherwise, if a ppl use aggregation using 'stats' but doesn't group by using 'by', then each field in output is metric.\n\nThen for each given PPL, you could give the metric and dimension and date. One field will in only one of the metric, dimension or date.\n\nThen according to the metric number and dimension number of PPL result, you should first format the entrance code by metric_number, dimension_number, and date_number. For example, if metric_number = 1, dimension_number = 2, date_number=1, then the entrance code is  121.\nI define several use case categories here according to the entrance code.\nFor each category, I will define the entrance condition (number of metric and dimension)\nI will also give some defined attribute of generated vega-lite. Please refer to it to generate vega-lite.\n\nType 1:\nEntrance code: <1, 1, 0>\nDefined Attributes:\n      {\n      \"title\": \"<title>\",\n      \"description\": \"<description>\",\n      \"mark\": \"bar\",\n      \"encoding\": {\n        \"x\": {\n          \"field\": \"<metric name>\",\n          \"type\": \"quantitative\"\n        },\n        \"y\": {\n          \"field\": \"<dimension name>\",\n          \"type\": \"nominal\"\n        }\n      },\n    }\n\nType 2:\nEntrance code: <1, 2, 0>\nDefined Attributes:\n{\n      \"mark\": \"bar\",\n      \"encoding\": {\n        \"x\": {\n          \"field\": \"<metric 1>\",\n          \"type\": \"quantitative\"\n        },\n        \"y\": {\n          \"field\": \"<dimension 1>\",\n          \"type\": \"nominal\"\n        },\n        \"color\": {\n          \"field\": \"<dimension 2>\",\n          \"type\": \"nominal\"\n        }\n      }\n    }\n\n\nType 3\nEntrance code: <3, 1, 0>\nDefined Attributes:\n{\n    \"mark\": \"point\",\n    \"encoding\": {\n        \"x\": {\n            \"field\": \"<metric 1>\",\n            \"type\": \"quantitative\"\n        },\n        \"y\": {\n            \"field\": \"<metric 2>\",\n            \"type\": \"quantitative\"\n        },\n        \"size\": {\n            \"field\": \"<metric 3>\",\n            \"type\": \"quantitative\"\n        },\n        \"color\": {\n            \"field\": \"<dimension 1>\",\n            \"type\": \"nominal\"\n        }\n    }\n}\n\nType 4\nEntrance code: <2, 1, 0>\nDefined Attributes:\n{\n    \"mark\": \"point\",\n    \"encoding\": {\n        \"x\": {\n            \"field\": \"<mtric 1>\",\n            \"type\": \"quantitative\"\n        },\n        \"y\": {\n            \"field\": \"<metric 2>\",\n            \"type\": \"quantitative\"\n        },\n        \"color\": {\n            \"field\": \"<dimension 1>\",\n            \"type\": \"nominal\"\n        }\n    }\n}\n\nType 5:\nEntrance code: <2, 1, 1>\nDefined Attributes:\n{\n      \"layer\": [\n        {\n          \"mark\": \"bar\",\n          \"encoding\": {\n            \"x\": {\n              \"field\": \"<date 1>\",\n              \"type\": \"temporal\"\n            },\n            \"y\": {\n              \"field\": \"<metric 1>\",\n              \"type\": \"quantitative\",\n              \"axis\": {\n                \"title\": \"<metric 1 name>\"\n              }\n            },\n            \"color\": {\n              \"field\": \"<dimension 1>\",\n              \"type\": \"nominal\"\n            }\n          }\n        },\n        {\n          \"mark\": {\n            \"type\": \"line\",\n            \"color\": \"red\"\n          },\n          \"encoding\": {\n            \"x\": {\n              \"field\": \"<date 1>\",\n              \"type\": \"temporal\"\n            },\n            \"y\": {\n              \"field\": \"<metric 2>\",\n              \"type\": \"quantitative\",\n              \"axis\": {\n                \"title\": \"<metric 2 name>\",\n                \"orient\": \"right\"\n              }\n            },\n            \"color\": {\n              \"field\": \"<dimension 1>\",\n              \"type\": \"nominal\"\n            }\n          }\n        }\n      ],\n      \"resolve\": {\n        \"scale\": {\n          \"y\": \"independent\"\n        }\n      }\n    }\n\nType 6:\nEntrance code: <2, 0, 1>\nDefined Attributes:\n{\n      \"title\": \"<title>\",\n      \"description\": \"<description>\",\n      \"layer\": [\n        {\n          \"mark\": \"area\",\n          \"encoding\": {\n            \"x\": {\n              \"field\": \"<date 1>\",\n              \"type\": \"temporal\"\n            },\n            \"y\": {\n              \"field\": \"<metric 1>\",\n              \"type\": \"quantitative\",\n              \"axis\": {\n                \"title\": \"<metric 1 name>\"\n              }\n            }\n          }\n        },\n        {\n          \"mark\": {\n            \"type\": \"line\",\n            \"color\": \"black\"\n          },\n          \"encoding\": {\n            \"x\": {\n              \"field\": \"date\",\n              \"type\": \"temporal\"\n            },\n            \"y\": {\n              \"field\": \"metric 2\",\n              \"type\": \"quantitative\",\n              \"axis\": {\n                \"title\": \"<metric 2 name>\",\n                \"orient\": \"right\"\n              }\n            }\n          }\n        }\n      ],\n      \"resolve\": {\n        \"scale\": {\n          \"y\": \"independent\"\n        }\n      }\n    }\n    \nType 7:\nEntrance code: <1, 0, 1>\nDefined Attributes:\n{\n      \"title\": \"<title>\",\n      \"description\": \"<description>\",\n      \"mark\": \"line\",\n      \"encoding\": {\n        \"x\": {\n          \"field\": \"<date 1>\",\n          \"type\": \"temporal\",\n          \"axis\": {\n            \"title\": \"<date name>\"\n          }\n        },\n        \"y\": {\n          \"field\": \"<metric 1>\",\n          \"type\": \"quantitative\",\n          \"axis\": {\n            \"title\": \"<metric name>\"\n          }\n        }\n      }\n    }\n\nType 8:\nEntrance code: <1, 1, 1>\nDefined Attributes:\n{\n      \"title\": \"<title>\",\n      \"description\": \"<description>\",\n      \"mark\": \"line\",\n      \"encoding\": {\n        \"x\": {\n          \"field\": \"<date 1>\",\n          \"type\": \"temporal\",\n          \"axis\": {\n            \"title\": \"<date name>\"\n          }\n        },\n        \"y\": {\n          \"field\": \"<metric 1>\",\n          \"type\": \"quantitative\",\n          \"axis\": {\n            \"title\": \"<metric name>\"\n          }\n        },\n        \"color\": {\n          \"field\": \"<dimension 1>\",\n          \"type\": \"nominal\",\n          \"legend\": {\n            \"title\": \"<dimension name>\"\n          }\n        }\n      }\n    }\n\nType 9:\nEntrance code: <1, 2, 1>\nDefined Attributes:\n{\n      \"title\": \"<title>\",\n      \"description\": \"<description>\",\n      \"mark\": \"line\",\n      \"encoding\": {\n        \"x\": {\n          \"field\": \"<date 1>\",\n          \"type\": \"temporal\",\n          \"axis\": {\n            \"title\": \"<date name>\"\n          }\n        },\n        \"y\": {\n          \"field\": \"<metric 1>\",\n          \"type\": \"quantitative\",\n          \"axis\": {\n            \"title\": \"<metric 1>\"\n          }\n        },\n        \"color\": {\n          \"field\": \"<dimension 1>\",\n          \"type\": \"nominal\",\n          \"legend\": {\n            \"title\": \"<dimension 1>\"\n          }\n        },\n        \"facet\": {\n          \"field\": \"<dimension 2>\",\n          \"type\": \"nominal\",\n          \"columns\": 2\n        }\n      }\n    }\n\nType 10:\nEntrance code: all other code\nAll others type.\nUse a table to show the result\n\n\nBesides, here are some requirements:\n1. Do not contain the key called 'data' in vega-lite specification.\n2. If mark.type = point and shape.field is a field of the data, the definition of the shape should be inside the root \"encoding\" object, NOT in the \"mark\" object, for example, {\"encoding\": {\"shape\": {\"field\": \"field_name\"}}}\n3. Please also generate title and description\n\nThe sample data in json format:\n${parameters.sampleData}\n\nThis is the schema of the data:\n${parameters.dataSchema}\n\nThe user used this PPL query to get the data: ${parameters.ppl}\n\nThe user's question is: ${parameters.input_question}\n\nNotice: Some fields like 'span()....' will be the date, but not metric and dimension. \nAnd one field will only count once in dimension count.  You should always pick field name from schema.\n And when you code is <2, 1, 0>, it belongs type 4.\n  And when you code is <1, 2, 0>, it belongs type 9.\n\n\nNow please reply a valid vega-lite specification in json based on above instructions.\nPlease return the number of dimension, metric and date. Then choose the type. \nPlease also return the type.\nFinally return the vega-lite specification according to the type.\nPlease make sure all the key in the schema matches the word I given. \nYour answer format should be:\nNumber of metrics:[list the metric name here, Don't use duplicate name]  <number of metrics {a}>  \nNumber of dimensions:[list the dimension name here]  <number of dimension {b}> \nNumber of dates:[list the date name here]  <number of dates {c}> \nThen format the entrance code by: <Number of metrics, Number of dimensions, Number of dates>\nType and its entrance code: <type number>: <its entrance code>\nThen apply the vega-lite requirements of the type.\n<vega-lite> {here is the vega-lite json} </vega-lite>\n\nAnd don't use 'transformer' in your vega-lite and wrap your vega-lite json in <vega-lite> </vega-lite> tags\n"
            },
            "name": "Text2Vega",
            "type": "MLModelTool"
          }
        },
        {
          "id": "create_instruction_based_t2vega_tool",
          "type": "create_tool",
          "previous_node_inputs": {
            "register_claude_model": "model_id"
          },
          "user_inputs": {
            "parameters": {
              "prompt": "You're an expert at creating vega-lite visualization. No matter what the user asks, you should reply with a valid vega-lite specification in json.\nYour task is to generate Vega-Lite specification in json based on the given sample data, the schema of the data, the PPL query to get the data and the user's input.\n\nBesides, here are some requirements:\n1. Do not contain the key called 'data' in vega-lite specification.\n2. If mark.type = point and shape.field is a field of the data, the definition of the shape should be inside the root \"encoding\" object, NOT in the \"mark\" object, for example, {\"encoding\": {\"shape\": {\"field\": \"field_name\"}}}\n3. Please also generate title and description\n\nThe sample data in json format:\n${parameters.sampleData}\n\nThis is the schema of the data:\n${parameters.dataSchema}\n\nThe user used this PPL query to get the data: ${parameters.ppl}\n\nThe user's input question is: ${parameters.input_question}\nThe user's instruction on the visualization is: ${parameters.input_instruction}\n\nNow please reply a valid vega-lite specification in json based on above instructions.\nPlease only contain vega-lite in your response.\n"
            },
            "name": "Text2Vega",
            "type": "MLModelTool"
          }
        },
        {
          "id": "t2vega_agent",
          "type": "register_agent",
          "previous_node_inputs": {
            "create_t2vega_tool": "tools"
          },
          "user_inputs": {
            "parameters": {},
            "type": "flow",
            "name": "t2vega agent",
            "description": "this is the t2vega agent that has a set of rules to generate the visualizations"
          }
        },
        {
          "id": "t2vega_instruction_based_agent",
          "type": "register_agent",
          "previous_node_inputs": {
            "create_instruction_based_t2vega_tool": "tools"
          },
          "user_inputs": {
            "parameters": {},
            "type": "flow",
            "name": "t2vega instruction based agent",
            "description": "this is the t2vega agent that supports instructions"
          }
        }
      ]
    }
  }
}
Use the workflow ID returned in the response to provision the resources:
POST /_plugins/_flow_framework/workflow/<workflow_id>/_provision
To view the status of the workflow and all created resources, send the following request:
GET /_plugins/_flow_framework/workflow/<workflow_id>/_status
Step 3: Configure the root agent
Next, configure a root agent for text to visualization:
POST /.plugins-ml-config/_doc/os_text2vega
{
  "type": "os_chat_root_agent",
  "configuration": {
    "agent_id": "<ROOT_AGENT_ID>"
  }
}
Configure the agent to receive user instructions for creating visualizations:
POST /.plugins-ml-config/_doc/os_text2vega_with_instructions
{
  "type": "os_chat_root_agent",
  "configuration": {
    "agent_id": "<ROOT_AGENT_ID>"
  }
}
This example demonstrates a system index. In security-enabled domains, only superadmins have permissions to execute this code. For information about making superadmin calls, see System indexes. For access permissions, contact your system administrator.
Step 4: Test the agent
You can verify that the agent was created successfully by calling the agent with an example payload:
POST /_plugins/_ml/agents/<ROOT_AGENT_ID>/_execute
{
  "parameters": {
    "input_question": "find unique visitors and average bytes every 3 hours",
    "input_instruction": "display with different layers, use independent scale for different layers, display unique visitors with light blue bar chart",
    "ppl": "source=opensearch_dashboards_sample_data_ecommerce| stats DISTINCT_COUNT(user) as unique_visitors, AVG(taxful_total_price) as avg_bytes by span(order_date, 3h)",
    "sampleData": """[{\"unique_visitors\":15,\"avg_bytes\":90.98684210526316,\"span(order_date,3h)\":\"2024-04-25 00:00:00\"},{\"unique_visitors\":14,\"avg_bytes\":72.72083333333333,\"span(order_date,3h)\":\"2024-04-25 03:00:00\"}]""",
    "dataSchema": """[{\"name\":\"unique_visitors\",\"type\":\"integer\"},{\"name\":\"avg_bytes\",\"type\":\"double\"},{\"name\":\"span(order_date,3h)\",\"type\":\"timestamp\"}]"""
  }
}
Generating a visualization from text
You can generate a visualization from text by calling the /api/assistant/text2vega API endpoint. The input_instruction parameter is optional:
POST /api/assistant/text2vega
{
  "input_instruction": "<input_instruction>",
  "input_question": "<input_question>",
  "ppl": "<ppl_query>",
  "dataSchema": "<data_schema_of_ppl_response>",
  "sampleData": "<sample_data_of_ppl_response>"
}
The following table describes the Text to Visualization API parameters.
| Parameter | Required/Optional | Description |
|---|---|---|
input_question | Required | The user’s original question used to generate the corresponding Piped Processing Language (PPL) query. |
ppl | Required | The generated PPL query that retrieves the data required for the visualization. |
dataSchema | Required | Describes the structure and types of the data fields in the visualization output, based on the PPL response. |
sampleData | Required | Provides sample entries from the data that will populate the visualization. |
input_instruction | Optional | Specifies the styling instructions, such as colors, for the visualization. |
Generating visualizations from text in OpenSearch Dashboards
To generate visualizations from text in OpenSearch Dashboards, use the following steps:
-
On the top menu bar, go to OpenSearch Dashboards > Visualize and then select Create visualization.
-
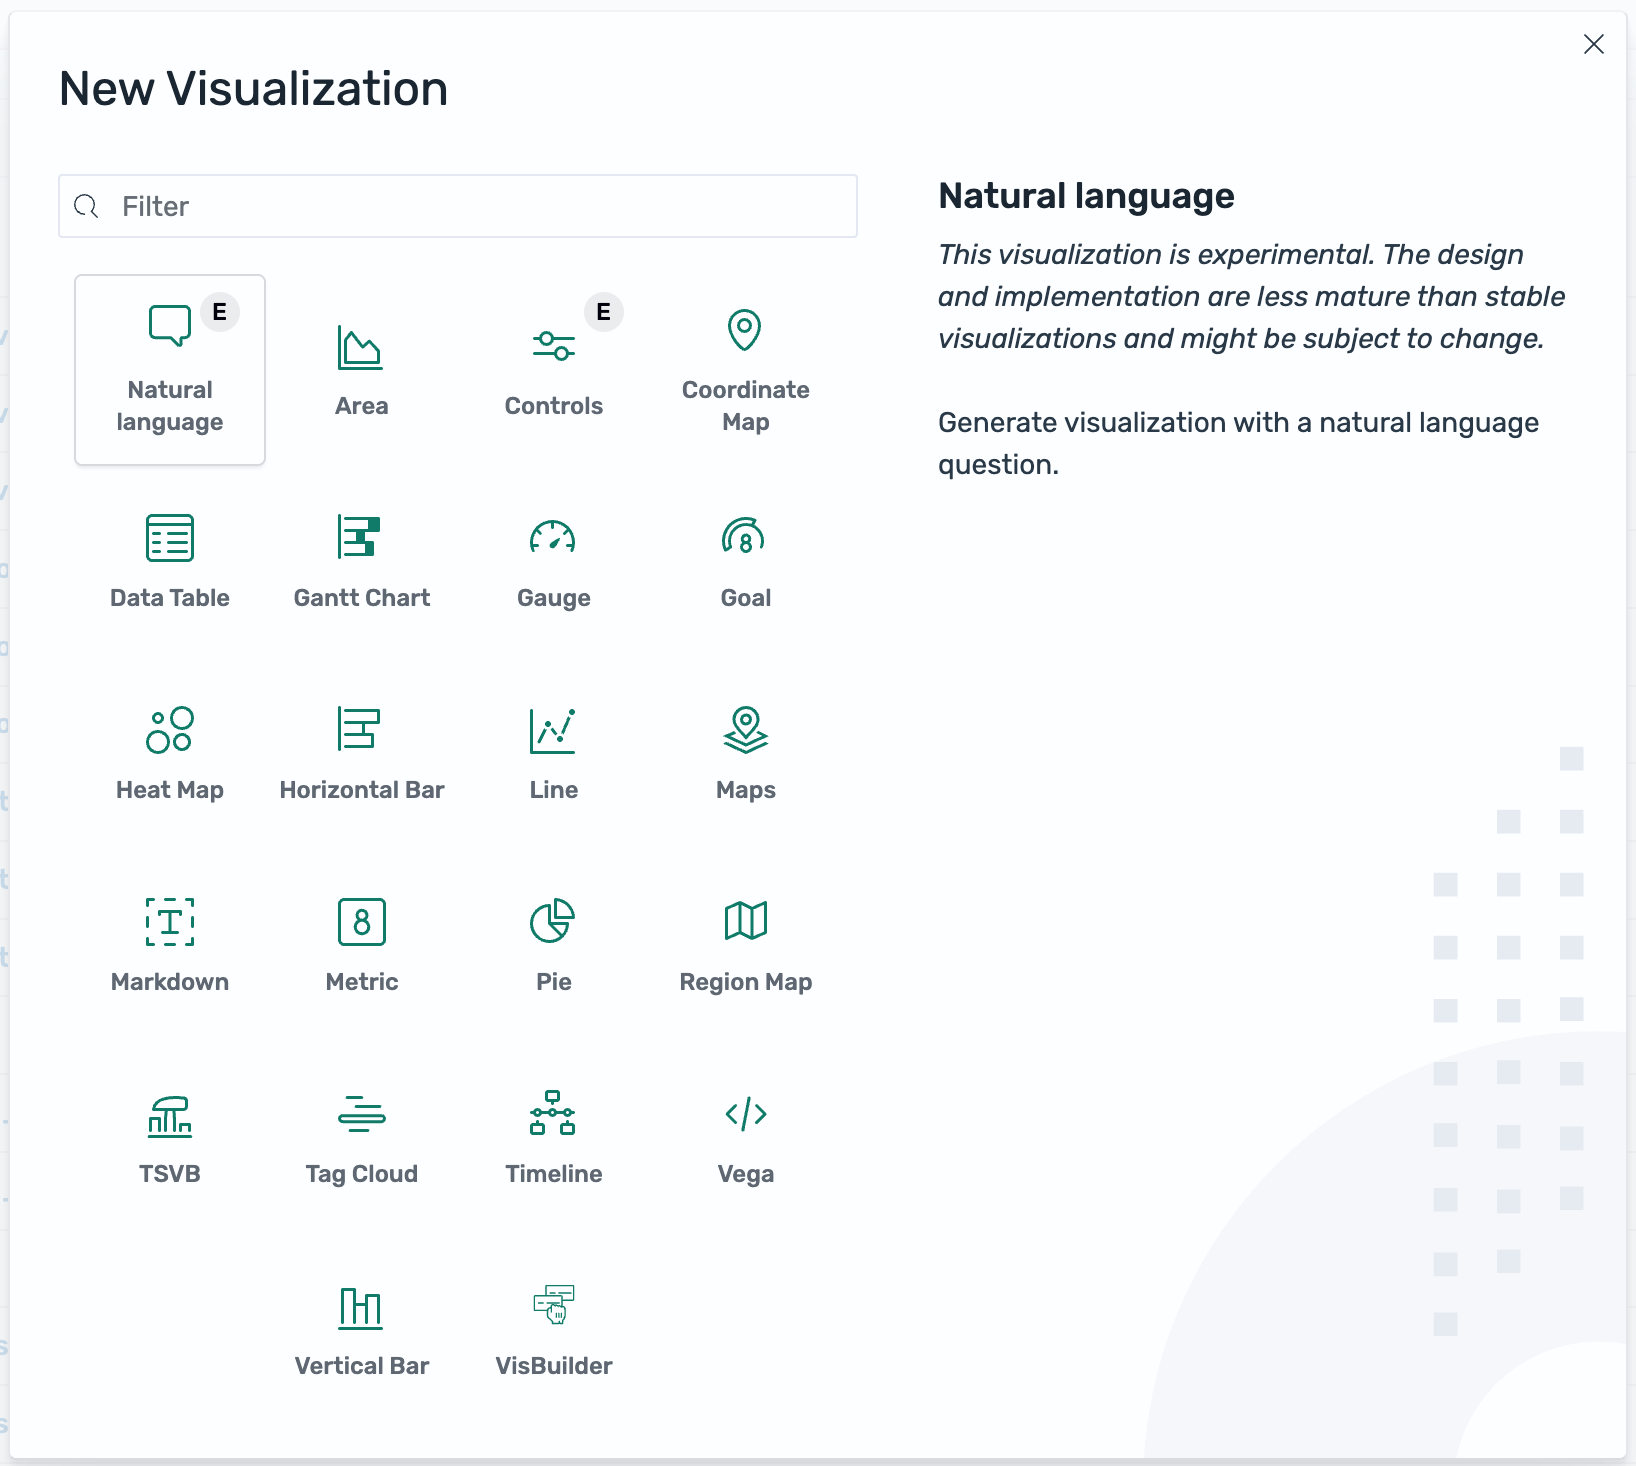
In the New Visualization dialog, select Natural language, as shown in the following image.

-
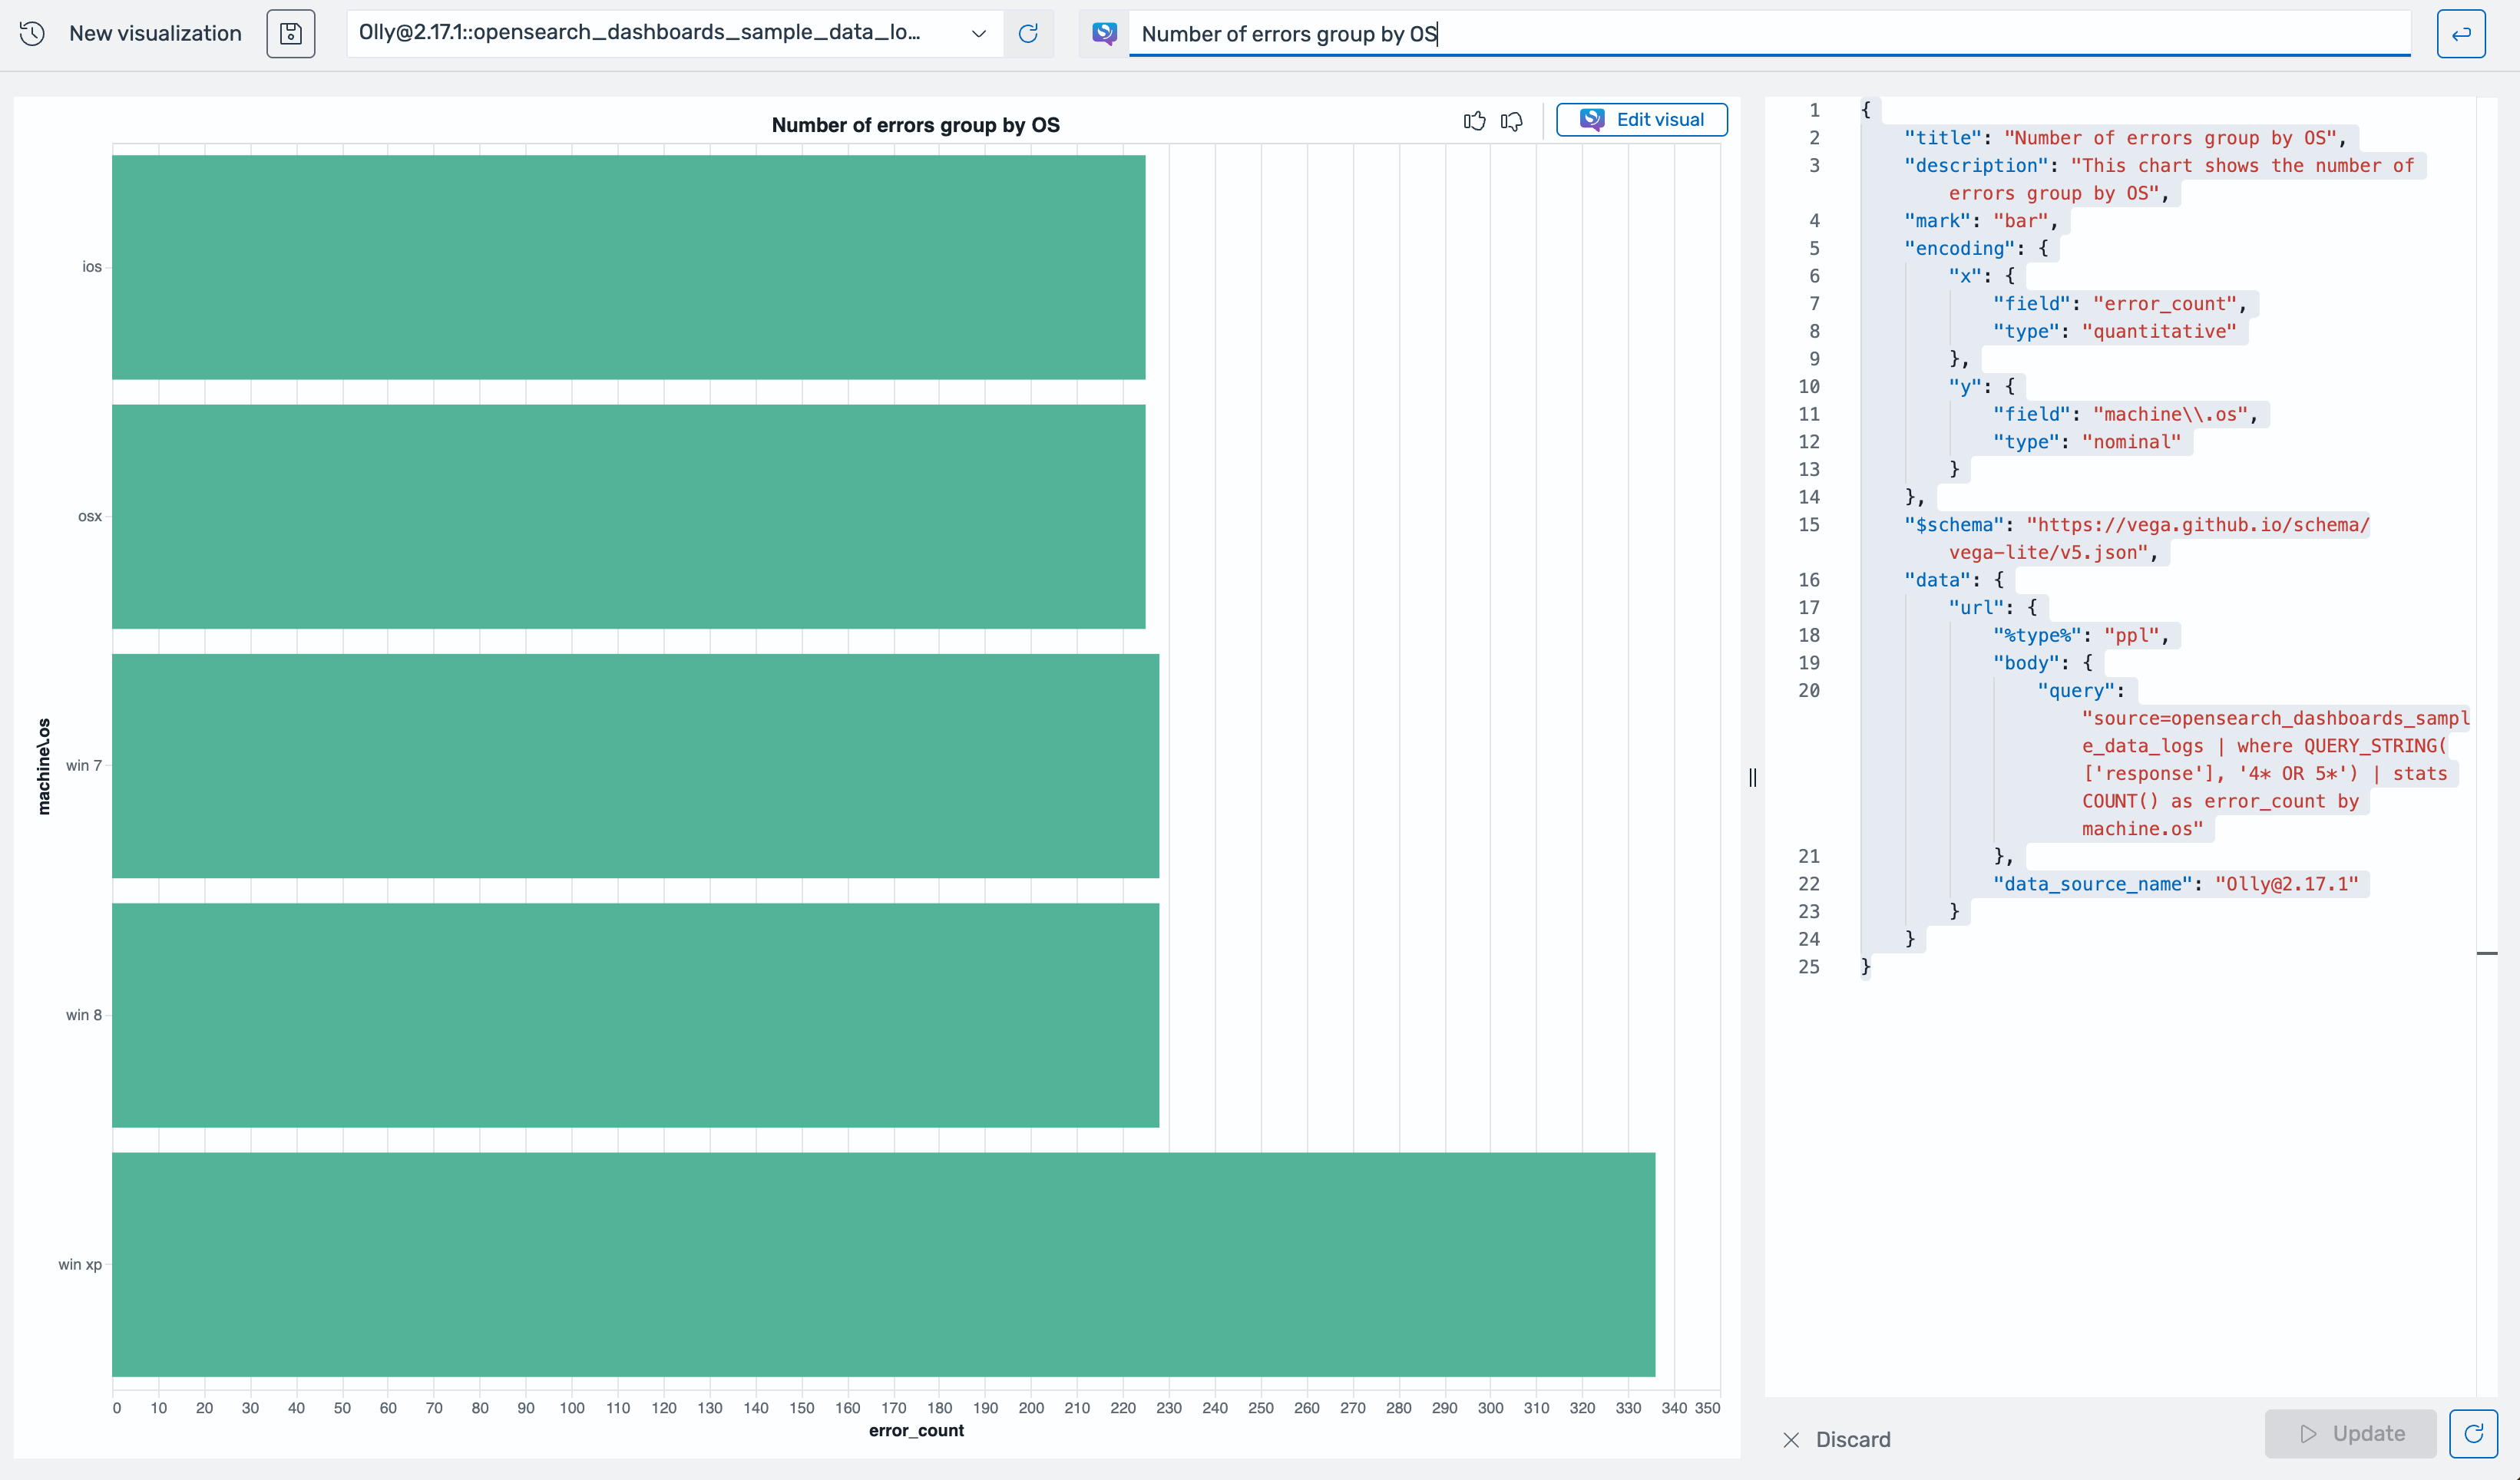
From the data sources dropdown list, select a data source, as shown in the following image.

-
In the text box on the upper right, enter a question using natural language. A new visualization is generated, as shown in the following image.

-
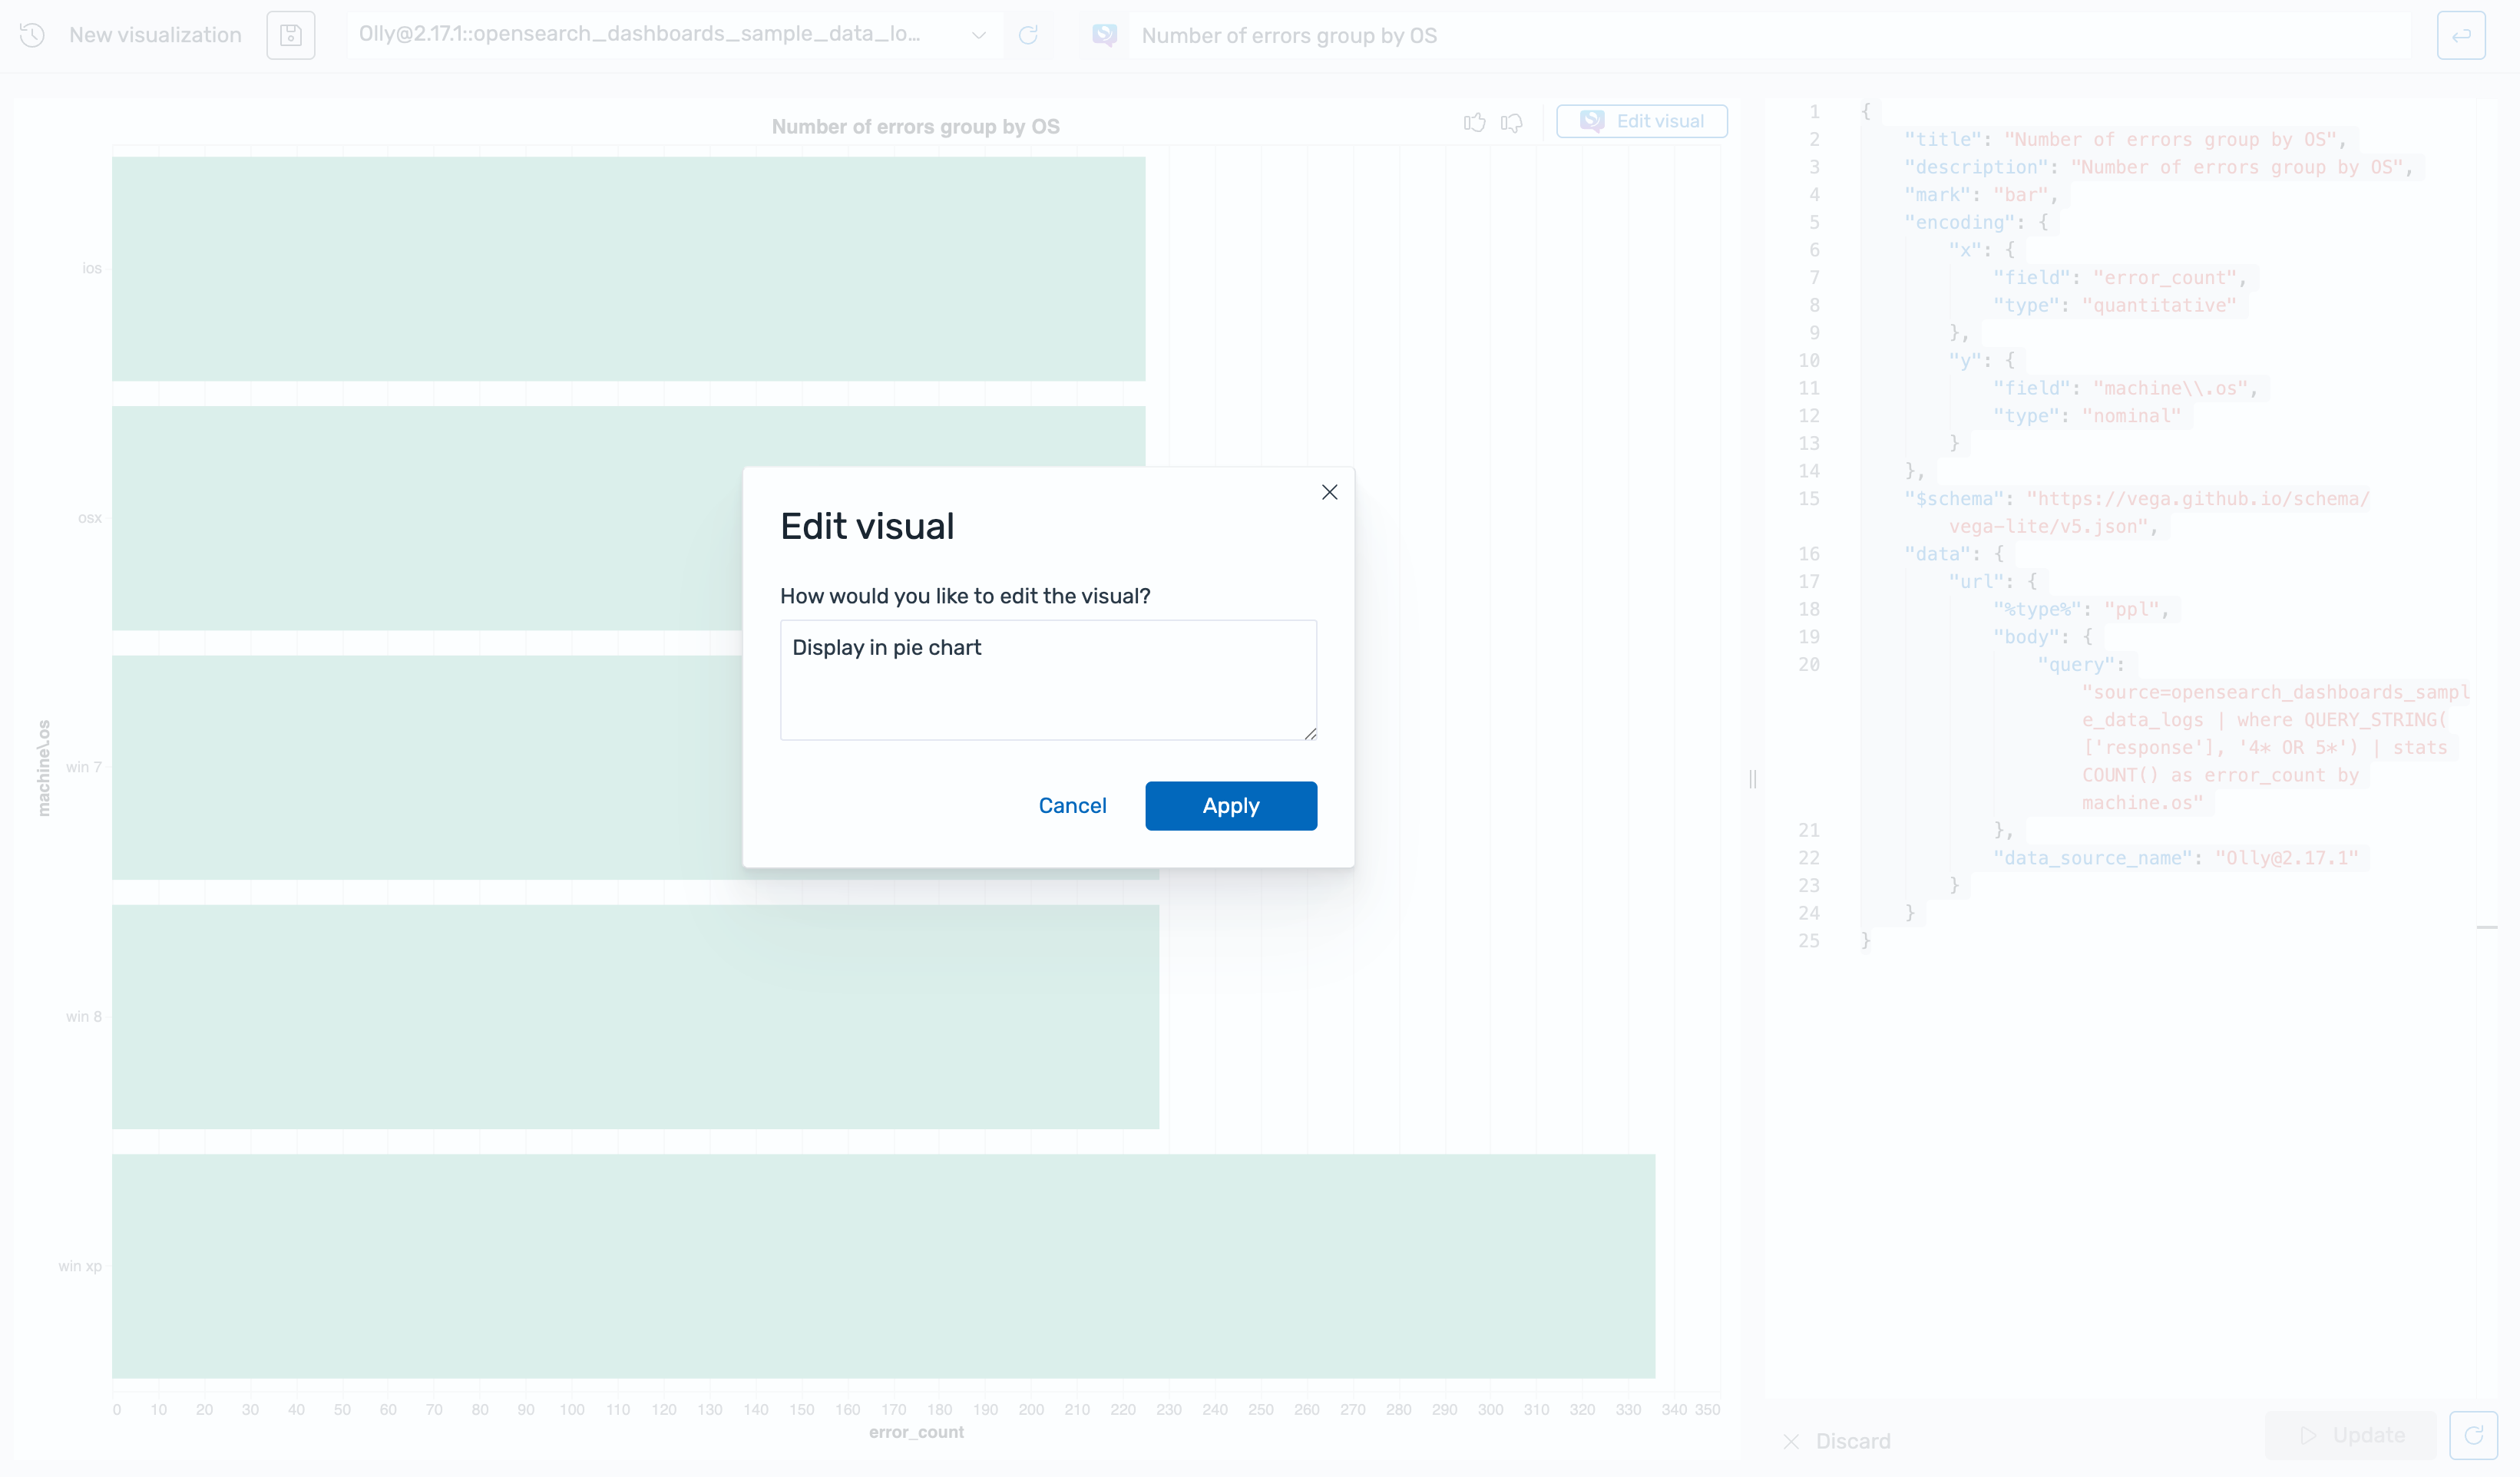
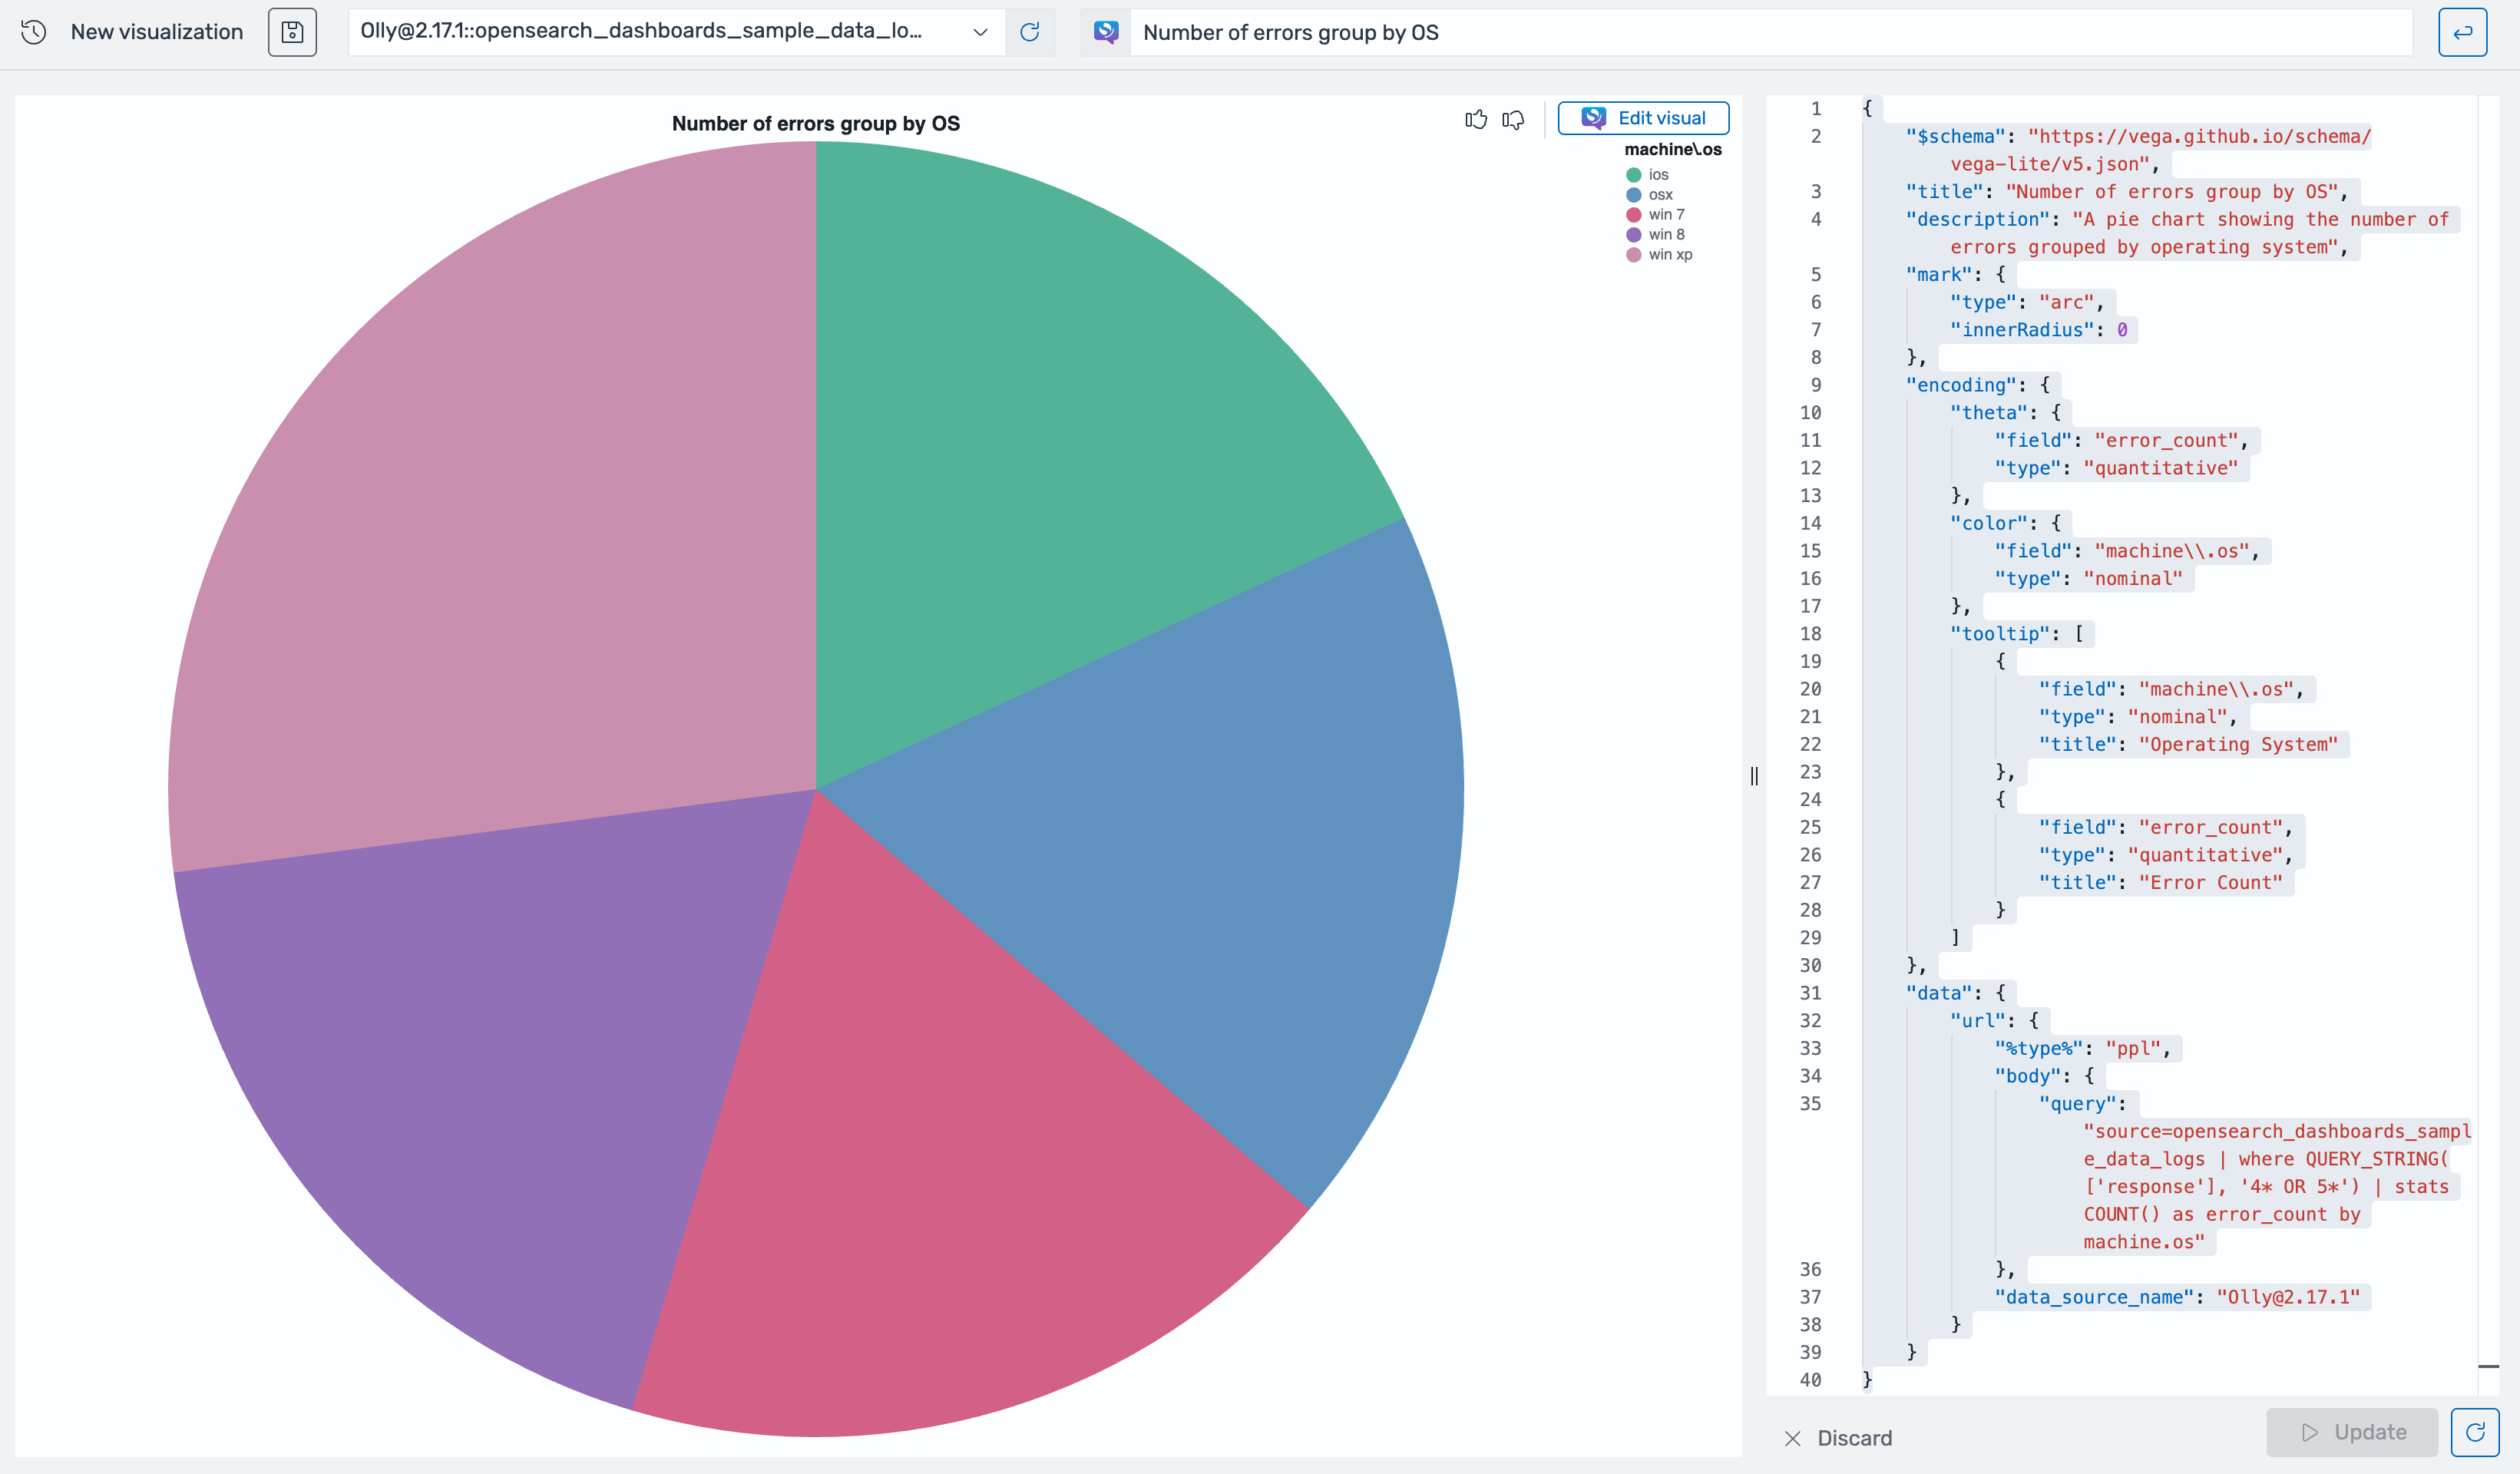
To modify the generated visualization, select Edit visual. In the Edit visual dialog, enter the desired modifications and then select Apply, as shown in the following image.

The visualization is updated, as shown in the following image.
