TSVB
The Time-Series Visual Builder (TSVB) is a powerful data visualization tool in OpenSearch Dashboards that allows you to create detailed time-series visualizations. One of its key features is the ability to add annotations or markers at specific time points based on index data. This feature is particularly useful for making connections between multiple indexes and building visualizations that display data over time, such as flight status, delays by type, and more. TSVB currently supports the following visualization types: Area, Line, Metric, Gauge, Markdown, and Data Table.
Creating TSVB visualizations from multiple data sources
Introduced 2.14
Before proceeding, ensure that the following configuration settings are enabled in the config/opensearch_dasboards.yaml file:
data_source.enabled: true
vis_type_timeseries.enabled: true
Once you have configured multiple data sources in OpenSearch Dashboards, you can use Vega to query those data sources. The following GIF shows the process of creating TSVB visualizations in OpenSearch Dashboards.
Step 1: Set up and connect data sources
Open OpenSearch Dashboards and follow these steps:
- Select Dashboards Management from the main menu on the left.
- Select Data sources and then select the Create data source button.
- On the Create data source page, enter the connection details and endpoint URL.
- On the Home page, select Add sample data and then select the Add data button for the Sample web logs dataset.
The following GIF shows the steps required to set up and connect a data source.
Step 2: Create the visualization
Follow these steps to create the visualization:
- From the menu on the left, select Visualize.
- On the Visualizations page, select Create Visualization and then select TSVB in the pop-up window.
Step 3: Specify data sources
After creating a TSVB visualization, data may appear based on your default index pattern. To change the index pattern or configure additional settings, follow these steps:
- In the Create window, select Panel options.
- Under Data source, select the OpenSearch cluster from which to pull data. In this case, choose your newly created data source.
- Under Index name, enter
opensearch_dashboards_sample_data_logs. - Under Time field, select
@timestamp. This setting specifies the time range for rendering the visualization.
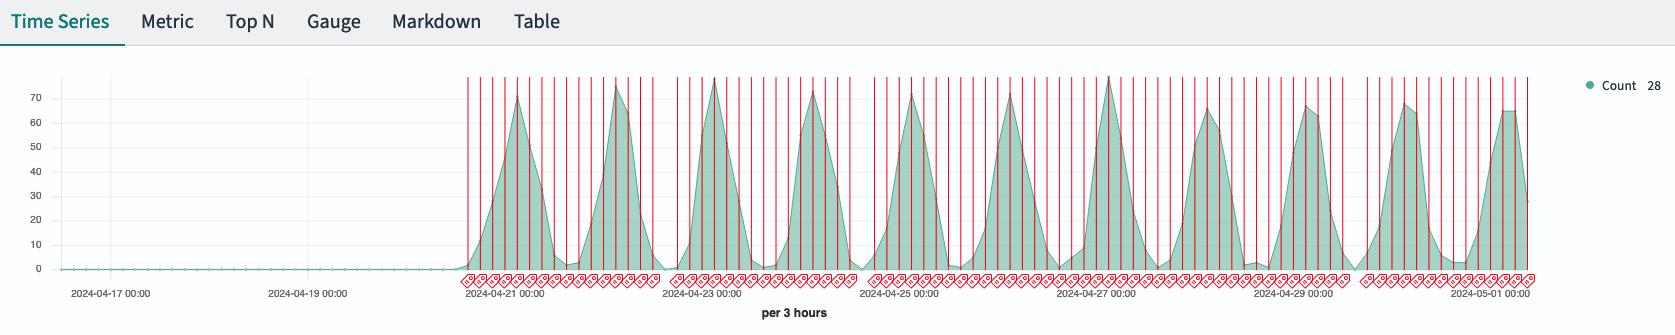
(Optional) Step 4: Add annotations
Annotations are markers that can be added to time-series visualizations. Follow these steps to add annotations:
- On the upper-left corner of the page, select Time Series.
- Select the Annotations tab and then Add data source.
- In the Index name field, specify the appropriate index. In this case, continue using the same index from the previous steps, that is,
opensearch_dashboards_sample_data_logs. - From Time field, select
@timestamp. - In the Fields field, enter
timestamp. - In the Row template field, enter
timestamp.
The visualization automatically updates to display your annotations, as shown in the following image.