RAG using DeepSeek-R1 in Amazon SageMaker
This tutorial shows you how to implement retrieval-augmented generation (RAG) using Amazon OpenSearch Service and the DeepSeek-R1 model.
If you are using self-managed OpenSearch instead of Amazon OpenSearch Service, create a connector to the DeepSeek-R1 model using the blueprint. For more information about creating a connector, see Connectors. Then go directly to Step 4.
Replace the placeholders beginning with the prefix your_ with your own values.
Prerequisites
Before you start, fulfill the following prerequisites.
When configuring Amazon settings, only change the values mentioned in this tutorial. Keep all other settings at their default values.
Deploy DeepSeek-R1 to Amazon SageMaker
Follow the instructions in this blog post to deploy the DeepSeek-R1 model to Amazon SageMaker.
Note the Amazon SageMaker DeepSeek-R1 model Amazon Resource Name (ARN) and URL; you’ll use them in the following steps.
Create an OpenSearch cluster
Go to the Amazon OpenSearch Service console and create an OpenSearch domain.
Note the domain ARN and URL; you’ll use them in the following steps.
Step 1: Create an IAM role for Amazon SageMaker access
To invoke the DeepSeek-R1 model in Amazon SageMaker, you must create an AWS Identity and Access Management (IAM) role with appropriate permissions. The connector will use this role to invoke the model.
Go to the IAM console, create a new IAM role named my_invoke_sagemaker_deepseek_model_role, and add the following trust policy and permissions:
- Custom trust policy:
{
    "Version": "2012-10-17",
    "Statement": [
        {
            "Effect": "Allow",
            "Principal": {
                "Service": "es.amazonaws.com"
            },
            "Action": "sts:AssumeRole"
        }
    ]
}
- Permissions:
{
    "Version": "2012-10-17",
    "Statement": [
        {
            "Effect": "Allow",
            "Action": [
                "sagemaker:InvokeEndpoint"
            ],
            "Resource": [
                "your_sagemaker_model_inference_endpoint_arn"
            ]
        }
    ]
}
Note the role ARN; you’ll use it in the following steps.
Step 2: Configure an IAM role in Amazon OpenSearch Service
Follow these steps to configure an IAM role in Amazon OpenSearch Service.
Step 2.1: Create an IAM role for signing connector requests
Generate a new IAM role specifically for signing your Create Connector API request.
Create an IAM role named my_create_sagemaker_deepseek_connector_role with the following trust policy and permissions:
- Custom trust policy:
{
  "Version": "2012-10-17",
  "Statement": [
    {
      "Effect": "Allow",
      "Principal": {
        "AWS": "your_iam_user_arn"
      },
      "Action": "sts:AssumeRole"
    }
  ]
}
You’ll use the your_iam_user_arn IAM user to assume the role in Step 3.1.
- Permissions:
{
  "Version": "2012-10-17",
  "Statement": [
    {
      "Effect": "Allow",
      "Action": "iam:PassRole",
      "Resource": "your_iam_role_arn_created_in_step1"
    },
    {
      "Effect": "Allow",
      "Action": "es:ESHttpPost",
      "Resource": "your_opensearch_domain_arn"
    }
  ]
}
Note this role ARN; you’ll use it in the following steps.
Step 2.2: Map a backend role
Follow these steps to map a backend role:
- Log in to OpenSearch Dashboards and select Security on the top menu.
- Select Roles, and then select the ml_full_access role.
- On the ml_full_access role details page, select Mapped users, and then select Manage mapping.
- Enter the IAM role ARN created in Step 2.1 in the Backend roles field, as shown in the following image.
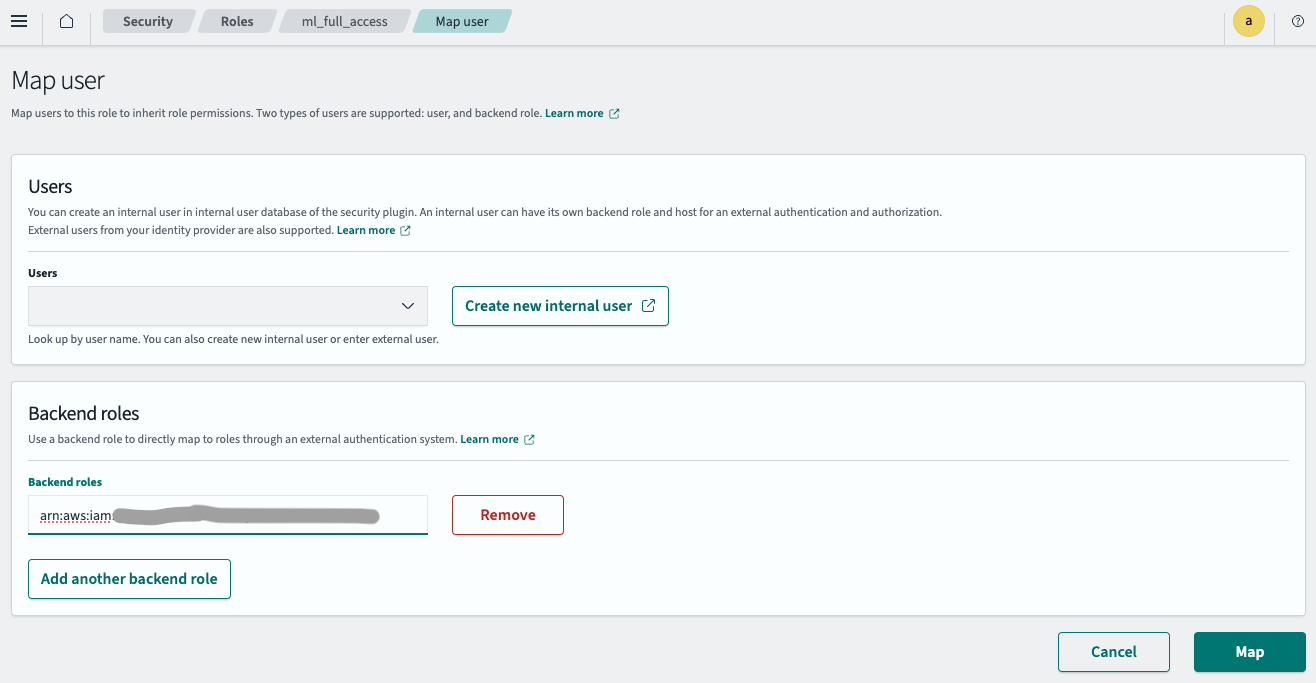
- Select Map.
The IAM role is now successfully configured in your OpenSearch cluster.
Step 3: Create a connector
Follow these steps to create a connector for the DeepSeek-R1 model. For more information about creating a connector, see Connectors.
Step 3.1: Get temporary credentials
Use the credentials of the IAM user specified in Step 2.1 to assume the role:
aws sts assume-role --role-arn your_iam_role_arn_created_in_step2.1 --role-session-name your_session_name
Copy the temporary credentials from the response and configure them in ~/.aws/credentials:
[default]
AWS_ACCESS_KEY_ID=your_access_key_of_role_created_in_step2.1
AWS_SECRET_ACCESS_KEY=your_secret_key_of_role_created_in_step2.1
AWS_SESSION_TOKEN=your_session_token_of_role_created_in_step2.1
Step 3.2: Create a connector
Run the following Python code with the temporary credentials configured in ~/.aws/credentials:
import boto3
import requests
from requests_aws4auth import AWS4Auth

host = 'your_amazon_opensearch_domain_endpoint'
region = 'your_amazon_opensearch_domain_region'
service = 'es'

credentials = boto3.Session().get_credentials()
awsauth = AWS4Auth(credentials.access_key, credentials.secret_key, region, service, session_token=credentials.token)


path = '/_plugins/_ml/connectors/_create'
url = host + path

payload = {
  "name": "DeepSeek R1 model connector",
  "description": "Connector for my Sagemaker DeepSeek model",
  "version": "1.0",
  "protocol": "aws_sigv4",
  "credential": {
    "roleArn": "your_iam_role_arn_created_in_step1"
  },
  "parameters": {
    "service_name": "sagemaker",
    "region": "your_sagemaker_model_region",
    "do_sample": true,
    "top_p": 0.9,
    "temperature": 0.7,
    "max_new_tokens": 512
  },
  "actions": [
    {
      "action_type": "PREDICT",
      "method": "POST",
      "url": "your_sagemaker_model_inference_endpoint",
      "headers": {
        "content-type": "application/json"
      },
      "request_body": "{ \"inputs\": \"${parameters.inputs}\", \"parameters\": {\"do_sample\": ${parameters.do_sample}, \"top_p\": ${parameters.top_p}, \"temperature\": ${parameters.temperature}, \"max_new_tokens\": ${parameters.max_new_tokens}} }",
      "post_process_function": "\n      if (params.result == null || params.result.length == 0) {\n        throw new Exception('No response available');\n      }\n      \n      def completion = params.result[0].generated_text;\n      return '{' +\n               '\"name\": \"response\",'+\n               '\"dataAsMap\": {' +\n                  '\"completion\":\"' + escape(completion) + '\"}' +\n             '}';\n    "
    }
  ]
}

headers = {"Content-Type": "application/json"}

r = requests.post(url, auth=awsauth, json=payload, headers=headers)
print(r.status_code)
print(r.text)
The script outputs a connector ID:
{"connector_id":"HnS5sJQBVQUimUskjpFl"}
Note the connector ID; you’ll use it in the next step.
Step 4: Create and test the model
Log in to OpenSearch Dashboards, open the DevTools console, and run the following requests to create and test the DeepSeek-R1 model.
-
Create a model group:
POST /_plugins/_ml/model_groups/_register { "name": "Sagemaker DeepSeek model", "description": "Test model group for Sagemaker DeepSeek model" }The response contains the model group ID:
{ "model_group_id": "H3S8sJQBVQUimUskW5Fm", "status": "CREATED" } -
Register the model:
POST /_plugins/_ml/models/_register { "name": "Sagemaker DeepSeek R1 model", "function_name": "remote", "description": "DeepSeek R1 model on Sagemaker", "model_group_id": "H3S8sJQBVQUimUskW5Fm", "connector_id": "HnS5sJQBVQUimUskjpFl" }The response contains the model ID:
{ "task_id": "Sim9sJQBts7fa6byEh1S", "status": "CREATED", "model_id": "Sym9sJQBts7fa6byEh1-" } -
Deploy the model:
POST /_plugins/_ml/models/Sym9sJQBts7fa6byEh1-/_deployThe response contains a task ID for the deployment operation:
{ "task_id": "TCm9sJQBts7fa6byex2j", "task_type": "DEPLOY_MODEL", "status": "COMPLETED" } -
Test the model:
POST /_plugins/_ml/models/Sym9sJQBts7fa6byEh1-/_predict { "parameters": { "inputs": "hello" } }The response contains the text generated by the model:
 {
   "inference_results": [
     {
       "output": [
         {
           "name": "response",
           "dataAsMap": {
             "response": [
               {
                 "generated_text": """hello<think>

 </think>

 Hello! How can I assist you today? 😊"""
               }
             ]
           }
         }
       ],
       "status_code": 200
     }
   ]
 }
Step 5: Configure RAG
Follow these steps to configure RAG.
Step 5.1: Create a search pipeline
Create a search pipeline with a RAG processor:
PUT /_search/pipeline/my-conversation-search-pipeline-deepseek
{
  "response_processors": [
    {
      "retrieval_augmented_generation": {
        "tag": "Demo pipeline",
        "description": "Demo pipeline Using DeepSeek R1",
        "model_id": "Sym9sJQBts7fa6byEh1-",
        "context_field_list": [
          "text"
        ],
        "system_prompt": "You are a helpful assistant.",
        "user_instructions": "Generate a concise and informative answer in less than 100 words for the given question"
      }
    }
  ]
}
Step 5.2: Create a vector database
Follow steps 1 and 2 of this tutorial to create an embedding model and a vector index. Then ingest sample data into the index:
POST _bulk
{"index": {"_index": "my-nlp-index", "_id": "1"}}
{"text": "Chart and table of population level and growth rate for the Ogden-Layton metro area from 1950 to 2023. United Nations population projections are also included through the year 2035.\nThe current metro area population of Ogden-Layton in 2023 is 750,000, a 1.63% increase from 2022.\nThe metro area population of Ogden-Layton in 2022 was 738,000, a 1.79% increase from 2021.\nThe metro area population of Ogden-Layton in 2021 was 725,000, a 1.97% increase from 2020.\nThe metro area population of Ogden-Layton in 2020 was 711,000, a 2.16% increase from 2019."}
{"index": {"_index": "my-nlp-index", "_id": "2"}}
{"text": "Chart and table of population level and growth rate for the New York City metro area from 1950 to 2023. United Nations population projections are also included through the year 2035.\\nThe current metro area population of New York City in 2023 is 18,937,000, a 0.37% increase from 2022.\\nThe metro area population of New York City in 2022 was 18,867,000, a 0.23% increase from 2021.\\nThe metro area population of New York City in 2021 was 18,823,000, a 0.1% increase from 2020.\\nThe metro area population of New York City in 2020 was 18,804,000, a 0.01% decline from 2019."}
{"index": {"_index": "my-nlp-index", "_id": "3"}}
{"text": "Chart and table of population level and growth rate for the Chicago metro area from 1950 to 2023. United Nations population projections are also included through the year 2035.\\nThe current metro area population of Chicago in 2023 is 8,937,000, a 0.4% increase from 2022.\\nThe metro area population of Chicago in 2022 was 8,901,000, a 0.27% increase from 2021.\\nThe metro area population of Chicago in 2021 was 8,877,000, a 0.14% increase from 2020.\\nThe metro area population of Chicago in 2020 was 8,865,000, a 0.03% increase from 2019."}
{"index": {"_index": "my-nlp-index", "_id": "4"}}
{"text": "Chart and table of population level and growth rate for the Miami metro area from 1950 to 2023. United Nations population projections are also included through the year 2035.\\nThe current metro area population of Miami in 2023 is 6,265,000, a 0.8% increase from 2022.\\nThe metro area population of Miami in 2022 was 6,215,000, a 0.78% increase from 2021.\\nThe metro area population of Miami in 2021 was 6,167,000, a 0.74% increase from 2020.\\nThe metro area population of Miami in 2020 was 6,122,000, a 0.71% increase from 2019."}
{"index": {"_index": "my-nlp-index", "_id": "5"}}
{"text": "Chart and table of population level and growth rate for the Austin metro area from 1950 to 2023. United Nations population projections are also included through the year 2035.\\nThe current metro area population of Austin in 2023 is 2,228,000, a 2.39% increase from 2022.\\nThe metro area population of Austin in 2022 was 2,176,000, a 2.79% increase from 2021.\\nThe metro area population of Austin in 2021 was 2,117,000, a 3.12% increase from 2020.\\nThe metro area population of Austin in 2020 was 2,053,000, a 3.43% increase from 2019."}
{"index": {"_index": "my-nlp-index", "_id": "6"}}
{"text": "Chart and table of population level and growth rate for the Seattle metro area from 1950 to 2023. United Nations population projections are also included through the year 2035.\\nThe current metro area population of Seattle in 2023 is 3,519,000, a 0.86% increase from 2022.\\nThe metro area population of Seattle in 2022 was 3,489,000, a 0.81% increase from 2021.\\nThe metro area population of Seattle in 2021 was 3,461,000, a 0.82% increase from 2020.\\nThe metro area population of Seattle in 2020 was 3,433,000, a 0.79% increase from 2019."}
Step 5.3: Search the index
Run a vector search to retrieve documents from the vector database and use the DeepSeek model for RAG:
GET /my-nlp-index/_search?search_pipeline=my-conversation-search-pipeline-deepseek
{
  "query": {
    "neural": {
      "passage_embedding": {
        "query_text": "What's the population increase of New York City from 2021 to 2023? How is the trending comparing with Miami?",
        "model_id": "USkHsZQBts7fa6bybx3G",
        "k": 5
      }
    }
  },
  "size": 4,
  "_source": [
    "text"
  ],
  "ext": {
    "generative_qa_parameters": {
      "llm_model": "bedrock/claude",
      "llm_question": "What's the population increase of New York City from 2021 to 2023? How is the trending comparing with Miami?",
      "context_size": 5,
      "timeout": 15
    }
  }
}
The response includes both the relevant documents retrieved from the vector search (in the hits array) and the generated answer from the DeepSeek model (in the ext.retrieval_augmented_generation object):
{
  "took": 5,
  "timed_out": false,
  "_shards": {
    "total": 5,
    "successful": 5,
    "skipped": 0,
    "failed": 0
  },
  "hits": {
    "total": {
      "value": 6,
      "relation": "eq"
    },
    "max_score": 0.05248103,
    "hits": [
      {
        "_index": "my-nlp-index",
        "_id": "2",
        "_score": 0.05248103,
        "_source": {
          "text": """Chart and table of population level and growth rate for the New York City metro area from 1950 to 2023. United Nations population projections are also included through the year 2035.\nThe current metro area population of New York City in 2023 is 18,937,000, a 0.37% increase from 2022.\nThe metro area population of New York City in 2022 was 18,867,000, a 0.23% increase from 2021.\nThe metro area population of New York City in 2021 was 18,823,000, a 0.1% increase from 2020.\nThe metro area population of New York City in 2020 was 18,804,000, a 0.01% decline from 2019."""
        }
      },
      {
        "_index": "my-nlp-index",
        "_id": "4",
        "_score": 0.029023321,
        "_source": {
          "text": """Chart and table of population level and growth rate for the Miami metro area from 1950 to 2023. United Nations population projections are also included through the year 2035.\nThe current metro area population of Miami in 2023 is 6,265,000, a 0.8% increase from 2022.\nThe metro area population of Miami in 2022 was 6,215,000, a 0.78% increase from 2021.\nThe metro area population of Miami in 2021 was 6,167,000, a 0.74% increase from 2020.\nThe metro area population of Miami in 2020 was 6,122,000, a 0.71% increase from 2019."""
        }
      },
      {
        "_index": "my-nlp-index",
        "_id": "3",
        "_score": 0.028097045,
        "_source": {
          "text": """Chart and table of population level and growth rate for the Chicago metro area from 1950 to 2023. United Nations population projections are also included through the year 2035.\nThe current metro area population of Chicago in 2023 is 8,937,000, a 0.4% increase from 2022.\nThe metro area population of Chicago in 2022 was 8,901,000, a 0.27% increase from 2021.\nThe metro area population of Chicago in 2021 was 8,877,000, a 0.14% increase from 2020.\nThe metro area population of Chicago in 2020 was 8,865,000, a 0.03% increase from 2019."""
        }
      },
      {
        "_index": "my-nlp-index",
        "_id": "6",
        "_score": 0.026973149,
        "_source": {
          "text": """Chart and table of population level and growth rate for the Seattle metro area from 1950 to 2023. United Nations population projections are also included through the year 2035.\nThe current metro area population of Seattle in 2023 is 3,519,000, a 0.86% increase from 2022.\nThe metro area population of Seattle in 2022 was 3,489,000, a 0.81% increase from 2021.\nThe metro area population of Seattle in 2021 was 3,461,000, a 0.82% increase from 2020.\nThe metro area population of Seattle in 2020 was 3,433,000, a 0.79% increase from 2019."""
        }
      }
    ]
  },
  "ext": {
    "retrieval_augmented_generation": {
      "answer": """You are a helpful assistant.\nGenerate a concise and informative answer in less than 100 words for the given question\nSEARCH RESULT 1: Chart and table of population level and growth rate for the New York City metro area from 1950 to 2023. United Nations population projections are also included through the year 2035.\nThe current metro area population of New York City in 2023 is 18,937,000, a 0.37% increase from 2022.\nThe metro area population of New York City in 2022 was 18,867,000, a 0.23% increase from 2021.\nThe metro area population of New York City in 2021 was 18,823,000, a 0.1% increase from 2020.\nThe metro area population of New York City in 2020 was 18,804,000, a 0.01% decline from 2019.\nSEARCH RESULT 2: Chart and table of population level and growth rate for the Miami metro area from 1950 to 2023. United Nations population projections are also included through the year 2035.\nThe current metro area population of Miami in 2023 is 6,265,000, a 0.8% increase from 2022.\nThe metro area population of Miami in 2022 was 6,215,000, a 0.78% increase from 2021.\nThe metro area population of Miami in 2021 was 6,167,000, a 0.74% increase from 2020.\nThe metro area population of Miami in 2020 was 6,122,000, a 0.71% increase from 2019.\nSEARCH RESULT 3: Chart and table of population level and growth rate for the Chicago metro area from 1950 to 2023. United Nations population projections are also included through the year 2035.\nThe current metro area population of Chicago in 2023 is 8,937,000, a 0.4% increase from 2022.\nThe metro area population of Chicago in 2022 was 8,901,000, a 0.27% increase from 2021.\nThe metro area population of Chicago in 2021 was 8,877,000, a 0.14% increase from 2020.\nThe metro area population of Chicago in 2020 was 8,865,000, a 0.03% increase from 2019.\nSEARCH RESULT 4: Chart and table of population level and growth rate for the Seattle metro area from 1950 to 2023. United Nations population projections are also included through the year 2035.\nThe current metro area population of Seattle in 2023 is 3,519,000, a 0.86% increase from 2022.\nThe metro area population of Seattle in 2022 was 3,489,000, a 0.81% increase from 2021.\nThe metro area population of Seattle in 2021 was 3,461,000, a 0.82% increase from 2020.\nThe metro area population of Seattle in 2020 was 3,433,000, a 0.79% increase from 2019.\nQUESTION: What's the population increase of New York City from 2021 to 2023? How is the trending comparing with Miami\nAlright, let's tackle this question step by step. The user is asking for the population increase of New York City from 2021 to 2023 and how this trend compares to Miami's.

First, I'll look through the search results to find the relevant data. From SEARCH RESULT 1, I see the populations for NYC in 2021, 2022, and 2023. In 2021, it was 18,823,000, and by 2023, it's 18,937,000. That's an increase of 114,000 over two years.

Next, I'll calculate the annual growth rates. From 2021 to 2022, the growth rate was 0.23%, and from 2022 to 2023, it's 0.37%. So, the trend shows an increase in the growth rate each year.

Now, looking at Miami in SEARCH RESULT 2, the population in 2021 was 6,167,000, and in 2023, it's 6,265,000. That's an increase of 98,000 over the same period. The growth rates were 0.74% in 2021-2022 and 0.8% in 2022-2023, also showing an increasing trend but at a higher rate than NYC.

Putting it all together, NYC's population increased by 114,000 with growth rates rising from 0.23% to 0.37%. Miami saw a slightly smaller increase of 98,000 but with higher growth rates, from 0.74% to 0.8%. So, Miami's growth is both higher in absolute terms and has a faster increasing rate compared to NYC.
</think>

The population of New York City increased by 114,000 from 2021 to 2023. The growth rate rose from 0.1% in 2021 to 0.37% in 2023. Comparatively, Miami's population increased by 98,000 during the same period"""
    }
  }
}